


Key Features of Quadratic Polynomial Graphs
A quadratic polynomial in a single real variable is an algebraic expression of degree two, generally represented as $f(x) = a x^2 + b x + c$ where $a \neq 0$ and $a, b, c \in \mathbb{R}$. The graphical representation of such polynomials yields a curve known as a parabola, whose precise geometry and orientation are dictated by the values of $a$, $b$, and $c$.
Standard Formulation of the Quadratic Polynomial and Parabola Structure
Consider a quadratic polynomial $f(x) = a x^2 + b x + c$. The graph of $y = f(x)$ constitutes a parabola in the Cartesian plane. The coefficient $a$ dictates the direction in which the parabola opens. When $a > 0$, the parabola opens upwards, and when $a < 0$, the parabola opens downwards. If $a = 0$, the polynomial is not quadratic, and the resulting graph is linear.
The axis of symmetry of the parabola described by $y = a x^2 + b x + c$ is a vertical line. Its equation is given by $x = -\dfrac{b}{2a}$. This line passes through the vertex of the parabola, which is the extremal point on its curve. The coordinates of the vertex $(x_v, y_v)$ are found as follows:
Firstly, set $x_v = -\dfrac{b}{2a}$.
Then, calculate $y_v$ using $f(x_v)$:
$y_v = a(x_v)^2 + b x_v + c$
Substituting the value of $x_v$ gives
$y_v = a \left( -\dfrac{b}{2a} \right)^2 + b \left( -\dfrac{b}{2a} \right) + c$
Calculate the square:
$\left( -\dfrac{b}{2a} \right)^2 = \dfrac{b^2}{4 a^2}$
So, $y_v = a \cdot \dfrac{b^2}{4a^2} + b \cdot \left( -\dfrac{b}{2a} \right) + c$
$= \dfrac{a b^2}{4 a^2} - \dfrac{b^2}{2 a} + c$
$\dfrac{a b^2}{4 a^2}$ simplifies to $\dfrac{b^2}{4 a}$, thus:
$y_v = \dfrac{b^2}{4a} - \dfrac{b^2}{2a} + c$
To combine these fractions, use a common denominator:
$\dfrac{b^2}{4a} - \dfrac{2b^2}{4a} = -\dfrac{b^2}{4a}$
Therefore, $y_v = -\dfrac{b^2}{4a} + c$.
Alternatively, $y_v = f\left(-\dfrac{b}{2a}\right)$. The vertex is hence
$\left(-\dfrac{b}{2a}, \; c - \dfrac{b^2}{4a}\right)$.
X-Intercepts and Real Roots in the Parabolic Graph
The points at which the graph of $y = a x^2 + b x + c$ intersects the $x$-axis are the real roots (zeros) of the quadratic polynomial. These are obtained by solving $f(x) = 0$:
$a x^2 + b x + c = 0$
The discriminant $D$ is defined by $D = b^2 - 4 a c$.
There are three distinct possibilities, determined by the value of $D$:
$D > 0$: Two distinct real roots, parabola cuts the $x$-axis at two points.
$D = 0$: One real repeated root, parabola touches the $x$-axis at one point (vertex lies on the $x$-axis).
$D < 0$: No real roots, parabola does not intersect the $x$-axis.
The explicit formulas for the real roots (when they exist) are:
$x_1 = \dfrac{ -b + \sqrt{b^2 - 4ac} }{2a }, \quad x_2 = \dfrac{ -b - \sqrt{b^2 - 4ac} }{2a }$
For more detailed analysis of quadratic equations and their roots, refer to Quadratic Equations Roots.
Y-Intercept and Constant Term Interpretation
The $y$-intercept of the parabola is the point at which the curve meets the $y$-axis. This is found by setting $x = 0$ in $f(x)$, yielding the point $(0, c)$. The constant term $c$ is thus the $y$-coordinate of the intersection with the $y$-axis.
Significance of the Discriminant in Parabolic Geometry
The calculation and interpretation of the discriminant $D = b^2 - 4ac$ facilitates the prediction of the number and nature of $x$-intercepts of the parabola. Furthermore, it is employed in identifying the vertex's $y$-coordinate as $y_v = -\dfrac{D}{4a}$ using the previously derived relation for $y_v$.
Worked Example: Precise Construction of a Quadratic Parabola
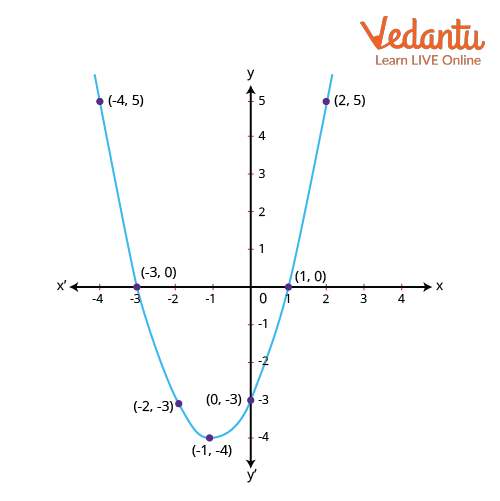
Given: $f(x) = x^2 + 2x - 3$
Here, $a = 1,\; b = 2,\; c = -3$.
1. Parabola Opening: Since $a = 1 > 0$, the parabola opens upwards.
2. Discriminant Calculation: $D = b^2 - 4 a c = 2^2 - 4 \cdot 1 \cdot (-3) = 4 + 12 = 16$.
3. Roots: Solve $x^2 + 2x - 3 = 0$.
Factorize: $x^2 + 2x - 3$
Write $-3$ as $+3 - 6$ to factor:
$x^2 + 2x - 3 = x^2 + 3x - x - 3 = x(x + 3) -1(x + 3) = (x + 3)(x - 1)$
Thus, $x = -3$ and $x = 1$
4. Vertex:
$x_v = -\dfrac{b}{2a} = -\dfrac{2}{2} = -1$
$y_v = f(-1) = (-1)^2 + 2(-1) - 3 = 1 - 2 - 3 = -4$
So, the vertex is at $(-1, -4)$.
5. $y$-intercept: Set $x = 0$: $f(0) = 0^2 + 2 \cdot 0 - 3 = -3$. Thus, the $y$-intercept is $(0, -3)$.
The points $(-3, 0)$ and $(1, 0)$ are the $x$-intercepts, while $(0, -3)$ is the $y$-intercept, and $(-1, -4)$ is the vertex.
For exploration of maximum and minimum values, see Max And Min Of Quadratic Polynomial.
Sum and Product of Zeros: Algebraic Connection to Coefficients
Let the zeros (roots) of $f(x) = a x^2 + b x + c$ be $\alpha$ and $\beta$. Using the quadratic factorization, we can write:
$f(x) = a(x - \alpha)(x - \beta)$
Expanding this product:
$= a\; (x^2 - (\alpha + \beta)x + \alpha\beta)$
$= a x^2 - a(\alpha + \beta)x + a \alpha\beta$
Comparing coefficients with $a x^2 + b x + c$, equate terms:
$-a(\alpha + \beta) = b$
$\implies \alpha + \beta = -\dfrac{b}{a}$
$a \alpha \beta = c$
$\implies \alpha \beta = \dfrac{c}{a}$
Result: The sum of the zeros of the quadratic polynomial is $-\dfrac{b}{a}$, and the product of the zeros is $\dfrac{c}{a}$.
For background on general polynomial functions, refer to Functions And Its Types.
Orientation of the Parabola and Role of the Leading Coefficient
The sign of the coefficient $a$ in $f(x) = a x^2 + b x + c$ is solely responsible for determining the direction in which the parabola opens. When $a > 0$, the arms of the parabola extend upwards, and for $a < 0$, they extend downwards. This attribute also determines whether the function possesses a minimum value (if $a>0$) or a maximum value (if $a<0$) at the vertex.
For visual reference, the graphical shape of a standard parabola corresponding to $a > 0$ is illustrated below.
Additional Interpretations: Special Cases
When the quadratic polynomial has a double root ($D = 0$), the vertex of the parabola coincides with the $x$-axis. When $D < 0$, both roots are non-real, and the parabola does not intersect the $x$-axis at any real point. These cases are directly reflected in the nature and placement of the graph.
In quadratic polynomials of the form $y^2 + py + q = 0$, with $y$ as the variable instead of $x$, the parabolic graph is oriented horizontally. The principles for calculation of roots, vertex, and intercepts remain analogous, though the variable roles are exchanged.
Summary of Structural Features in Quadratic Polynomial Graphs
The graph of a quadratic polynomial $y = a x^2 + b x + c$ is a parabola with symmetry about the vertical line $x = -\dfrac{b}{2a}$. The vertex is situated at $\left(-\dfrac{b}{2a},\; c - \dfrac{b^2}{4a}\right)$, and the $y$-intercept is $(0, c)$. Real roots of the polynomial, when present, are found using the quadratic formula. The nature of the parabola's $x$-intercepts is determined by the discriminant. The orientation is established by the sign of $a$. The relations $\alpha + \beta = -\dfrac{b}{a}$ and $\alpha\beta = \dfrac{c}{a}$ always hold for the zeros of the quadratic. For study of other standard graphs in JEE, refer to Graphs Of Sine And Cosine.
Further Study and Related Concepts
Comprehensive understanding of the graph of a quadratic polynomial enables deeper analysis of optimization, loci, and inequalities. Progression to limits and continuity can be pursued at Limit Continuity And Differentiability.
FAQs on Understanding the Graph of a Quadratic Polynomial
1. What is the graph of a quadratic polynomial?
The graph of a quadratic polynomial is a parabola. It opens upwards or downwards depending on the sign of the leading coefficient and has the following features:
- The highest or lowest point is called the vertex.
- The axis of symmetry divides the parabola into two equal halves.
- The graph can intersect the x-axis at zero, one, or two points (the roots).
2. How do you plot the graph of a quadratic polynomial?
To plot the graph of a quadratic polynomial, find key points and sketch the parabola shape. The essential steps are:
- Write the equation in the form y = ax2 + bx + c.
- Find the vertex using -b/2a.
- Calculate corresponding y value of the vertex.
- Find the axis of symmetry: x = -b/2a.
- Mark x-intercepts (roots) if any, by setting y=0 and solving the equation.
- Choose other x-values to get more points.
- Draw a smooth curve passing through these points (parabola).
3. What are the features of the graph of y = ax2 + bx + c?
The graph of y = ax2 + bx + c has several key features:
- Shape: Parabola
- Direction: Opens upwards if a > 0, downwards if a < 0
- Vertex: Point of maximum or minimum value
- Axis of symmetry: Vertical line x = -b/2a
- Roots: x-values where y = 0
- y-intercept: Point where graph crosses y-axis (x = 0, y = c)
4. How does changing the coefficient 'a' affect the graph of a quadratic polynomial?
The coefficient 'a' affects both the direction and width of the parabola:
- If a > 0, the parabola opens upwards
- If a < 0, the parabola opens downwards
- Greater |a| values make the parabola narrower (steeper)
- Smaller |a| values make the parabola wider
5. What is the vertex of a quadratic polynomial and how is it calculated?
The vertex is the turning point of the parabola and represents either its maximum or minimum value. To find the vertex:
- The x-coordinate is x = -b/2a
- The y-coordinate is found by substituting x into the original equation
- The vertex = (-b/2a, y)
6. How do you determine the direction in which a parabola opens?
The direction a parabola opens depends on the sign of 'a' in the quadratic equation.
- Parabola opens upwards if a > 0
- Parabola opens downwards if a < 0
7. How can the number of real roots of a quadratic polynomial be predicted from its graph?
The number of real roots equals the number of points where the parabola intersects the x-axis:
- Two roots: Parabola crosses x-axis at two points
- One root: Parabola just touches x-axis (vertex on x-axis)
- No real roots: Parabola does not cross x-axis
8. Why is the axis of symmetry important in the graph of a quadratic polynomial?
The axis of symmetry divides the parabola into two mirror-image halves.
- Its equation is always x = -b/2a
- The vertex lies on this line
- Helps plot the graph faster and ensures accuracy
9. What determines if the parabola opens upward or downward in quadratic graphs?
The sign of the coefficient 'a' in y = ax2 + bx + c determines the opening direction of the parabola:
- If a > 0, the parabola opens upward
- If a < 0, the parabola opens downward
10. How do you find the y-intercept of a quadratic polynomial's graph?
The y-intercept is the value of y when x = 0 in the quadratic equation:
- Substitute x = 0 in y = ax2 + bx + c
- The y-intercept is c (the constant term)
- This is the point (0, c) on the graph
11. What is the standard form of a quadratic polynomial?
The standard form of a quadratic polynomial is y = ax2 + bx + c. In this form:
- a, b, c are real numbers, and a ≠ 0
- All key features of the graph like axis of symmetry, vertex, and roots are derived from this form
- Used for graphing and solving quadratic equations
12. What is the effect of the coefficient 'c' in the quadratic equation's graph?
The coefficient 'c' gives the y-intercept of the quadratic graph. This means:
- When x = 0, y = c
- The graph crosses the y-axis at (0, c)
- Changing 'c' shifts the graph up or down without changing its shape