


How to Plot Points on the X and Y Axes Easily
The x-axis and y-axis are two important lines that make a graph. A graph consists of a horizontal axis and a vertical axis where data can be represented. There are two ways to describe a point, horizontally and vertically, which are easily understood using a graph. In a graph, the x-axis is horizontal and the y-axis is vertical. In this article, we will learn about the x-axis and y-axis and we will also see the graph plotter with points along with solving a few examples.
X-axis and Y-axis
Any point on the coordinate plane can be described by an ordered pair, which is written as (x-coordinate, y-coordinate) where the x-coordinate denotes a point on the x-axis and the y-coordinate denotes a point on the y-axis. The ordinate or "y-axis" is another name for the y-axis and another name for the x-axis is known as the "abscissa" or "x graph."
X-axis and Y-axis on the Graph
A graph is made up of two crucial lines called the x and y axes. In a graph, data can be represented on both the horizontal and vertical axes. A graph makes it simple to understand how a point might be defined vertically or horizontally. The x-axis and y-axis on the graph are these two horizontal and vertical lines or axes, respectively. As the origin is where the x- and y-axes intersect.

X-axis and Y-axis Graph
Any Point on the Y-axis Is of the Form
The fact that each point on the graph (straight line) of a linear equation involving two variables corresponds to a solution to the linear equation. As a result, each answer to the linear equation can be represented as a distinct point on the equation's graph. Lines parallel to the y-axis and the x-axis, respectively, represent the graphs of x = a and y = a.
The shape of any point on the y-axis is of the form (0, y).
The Ordinate of All Points on the X-axis
Any point on the x-axis has coordinates of (x,0), where x is the abscissa and 0 is the ordinate. As a result, each point on the x-axis has an ordinate of 0. Thus, the ordinate of all points on the x-axis is zero.
Graph Plotter with Points
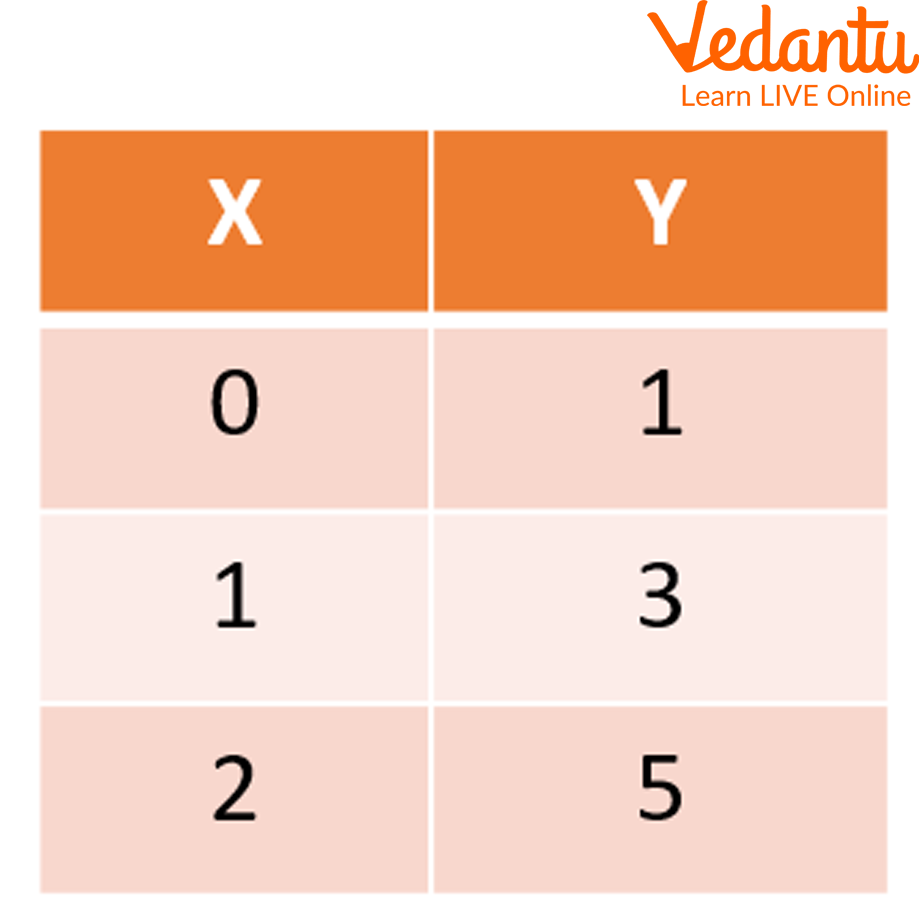
Take the linear equation y = 2x+1 as an example. Now, create a table with two columns for the values of x and y to graph this equation then draw a graph as follows:
Now by substituting the values in one of the variables we will complete the table.
So, if when x = 0
y = 2(0) + 1
=1
Similarly, when x = 1, y = 3 and when x = 2, y = 5.
Graph Plotter
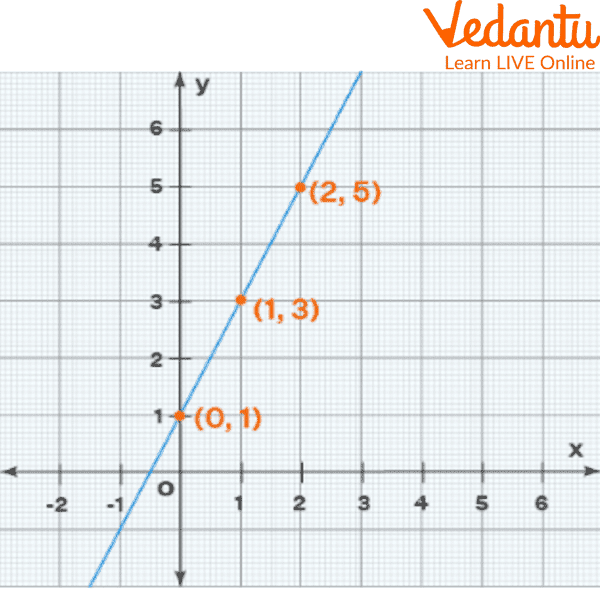
Now, we will plot the graph based on the above table.
So for locating the points on the graph, we just have to point to the x and y-axis.
So if x = 0 and y = 1. For this, the x-axis will be zero and on the y-axis, we have to go up to 1.
Therefore, the point will be (0,1). Similarly, other points can be drawn. In the end, join these points.
Graph Using Plotter Points
Solved Examples
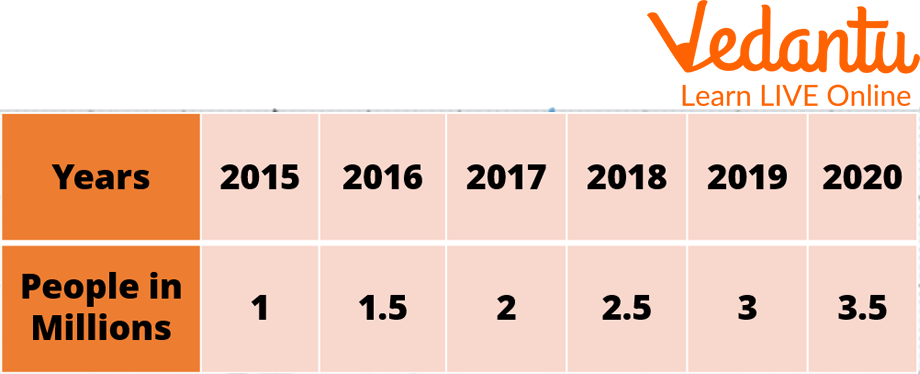
Q 1. The table for the X and Y graph shows the population of a city from 2015 to 2020 as:
Graph Plotter (Example 1)
Ans: The ordered pair is written as (x-coordinate, y-coordinate) or (x, y), where the x and y-coordinate implies a point on the x-axis or perpendicular distance from the y-axis whereas another one implies a point on the y-axis or perpendicular distance from the x-axis respectively. Each point is located on the graph indicated by an ordered pair with the x-axis coming first and the y-axis coming second. The chart is as follows:
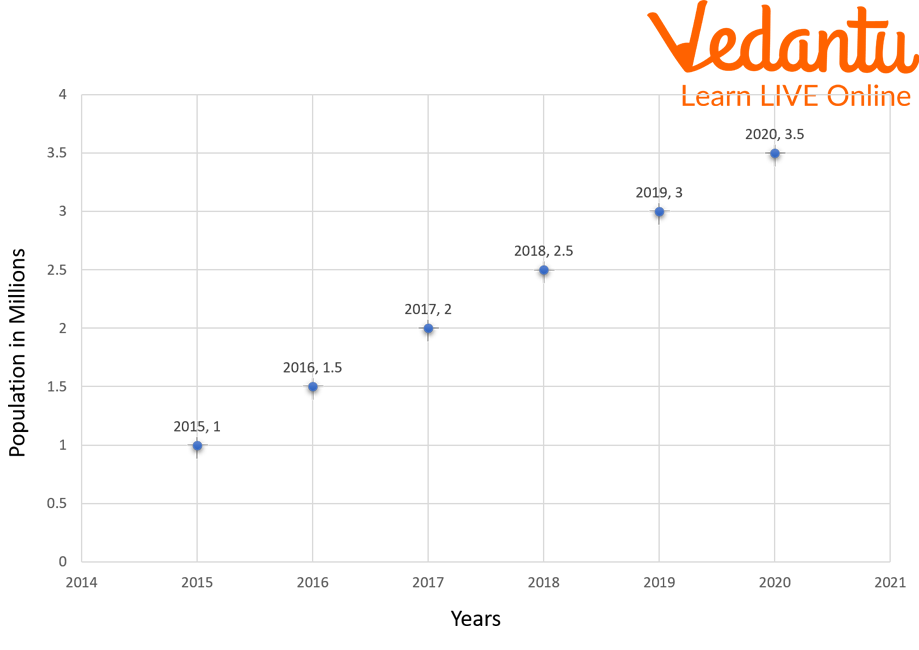
Graph (Example 1)
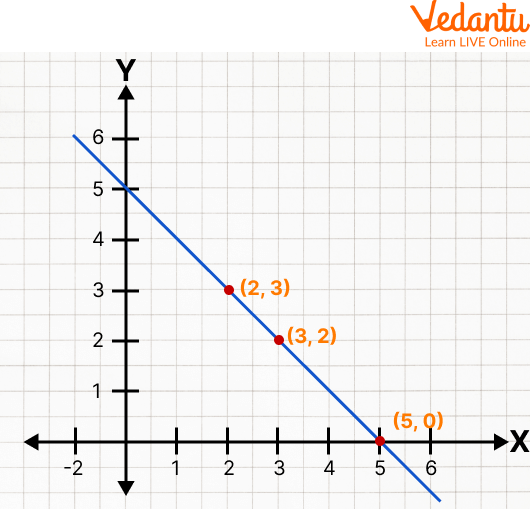
Q 2. Daniel's teacher assigns him a maths task with x and y axes that requires him to graph the points (3, 2) and (2, 3) and draw a line that connects them. Can you point to the location where it intersects the x-axis?
Ans: The graph can be used to plot the points as displayed.
Graph
Consequently, the line crosses the x-axis at that location (5, 0).
Practice Questions
Q 1. Draw a coordinate system and place the coordinates (1,2), (0,4), and (-1,-3) on it. Are all of the points on a line? Can you name the line?
Q 2. State true or false.
On the y-axis, the x coordinate is nonzero and the y coordinate is zero. Ans: False
The x-axis is a vertical line. Ans: False
On the x-axis, the x coordinate is nonzero and the y coordinate is zero. Ans: True
The y-axis is a vertical line. Ans: True
Summary
Any point on the coordinate plane is well defined by an ordered pair where the ordered pair is written as (x-coordinate, y-coordinate) or (x,y), where the x-coordinate represents a point on the x-axis or perpendicular distance from the y-axis and the y-coordinate represents a point on the y-axis or perpendicular distance from the x-axis. The point where the x-axis and y-axis intersect is known as the origin and is used as the reference point for the plane. The x-axis is also known as abscissa or x graph whereas the y-axis is also known as ordinate or y graph. Later, we have also seen how to plot the graph by using linear equations. In the end, we have included, solved examples, and practised problems to get a better understanding of the topic.
FAQs on X Axis and Y Axis: Definitions, Examples & Uses
1. What are the x-axis and y-axis in a Cartesian plane?
In a two-dimensional Cartesian plane, the x-axis is the horizontal number line, and the y-axis is the vertical number line. They intersect each other at a right angle (90 degrees) at a point known as the origin, which has the coordinates (0, 0).
2. What is the main difference between the x-axis and the y-axis?
The primary difference lies in their orientation and the type of variable they usually represent. The x-axis runs horizontally and typically plots the independent variable. The y-axis runs vertically and is used to plot the dependent variable, which changes in response to the independent variable.
3. What are the specific names given to the x and y coordinates?
The x-coordinate of a point is called the abscissa. It represents the perpendicular distance of the point from the y-axis. The y-coordinate of a point is called the ordinate, which represents its perpendicular distance from the x-axis. An ordered pair is written as (abscissa, ordinate).
4. How do the x-axis and y-axis divide the graph into quadrants?
The intersection of the x-axis and y-axis divides the Cartesian plane into four regions called quadrants. These are numbered in a counter-clockwise direction starting from the top right:
Quadrant I: Both x and y coordinates are positive (+, +).
Quadrant II: The x-coordinate is negative, and the y-coordinate is positive (-, +).
Quadrant III: Both x and y coordinates are negative (-, -).
Quadrant IV: The x-coordinate is positive, and the y-coordinate is negative (+, -).
5. Why is the x-coordinate always written before the y-coordinate in an ordered pair (x, y)?
This is a universally accepted mathematical convention to ensure consistency and avoid ambiguity. By always stating the horizontal position (x-coordinate) first and the vertical position (y-coordinate) second, anyone can locate the exact same point on a plane. This standard notation, (x, y), is fundamental to coordinate geometry.
6. What is the significance of a point lying directly on the x-axis or the y-axis?
If a point lies on the x-axis, its vertical distance from the origin is zero, which means its y-coordinate (ordinate) is always 0. Its coordinates will be of the form (x, 0). Conversely, if a point lies on the y-axis, its horizontal distance from the origin is zero, meaning its x-coordinate (abscissa) is always 0. Its coordinates will be of the form (0, y).
7. How do the x-axis and y-axis relate to independent and dependent variables in a graph?
In data representation, the x-axis is conventionally used to plot the independent variable, which is the factor that is changed or controlled (e.g., time). The y-axis is used for the dependent variable, which is the factor being measured and is expected to change in response (e.g., growth of a plant). This convention helps in clearly visualising cause-and-effect relationships.
8. What are the equations of the x-axis and y-axis themselves?
The equation of a line is a rule that is true for all points on that line. Since every point on the x-axis has a y-coordinate of 0, the equation for the x-axis is y = 0. Similarly, as every point on the y-axis has an x-coordinate of 0, the equation for the y-axis is x = 0.
9. Can you provide a real-world example of how the x-axis and y-axis are used to display information?
A simple example is a graph tracking a car's journey. The x-axis can represent 'Time in hours' (the independent variable), while the y-axis can represent 'Distance in kilometres' (the dependent variable). Plotting points like (1, 60) and (2, 120) would show that the car travelled 60 km in the first hour and 120 km in two hours, visually representing its speed and progress.