

How to Find the X-Coordinate: Steps and Common Examples
When you enter your room, have you seen your door beam getting support from the floor or noticed that this beam and the floor are in a straight line? Do you know what they are? Well, the straight standing line is vertical and we call it a y-axis or a vertical axis, while the floor supporting this beam also has a straight line lying horizontally, thus, we call it the horizontal axis or the x-axis.
Now, these lines meet at a common point and this point always stands at the ‘0’ mark, we call this ‘0’ the origin. So, when we try to understand all these x-axis and y-axis, and the origin, we use graph paper and take some points and mark them on the x and the y-axis. So, when we mark a point having a position (x,y), we call the x and y points the coordinates of that mark.
Here, we will be focusing on the x-coordinate and how to mark it on the graph.
What are X and Y Coordinates?
X and Y coordinates are addresses that help us to locate a point in two-dimensional space having two axes. Any point in the coordinate plane (position plane) is referred to by a point (x, y), where the x value is the position of the point with reference to the x-axis, and the y-axis value is the position of the point with reference to the y-axis.
The x and y coordinates of a point have positive or negative values that depend on the location of the point in the different quadrants.
Now, let us look at these two important terms relating to x and y coordinates.
Abscissa: It is the x value in the point (x, y), and is the distance of this point along the x-axis, from the origin.
Ordinate: It is the y value in the coordinate (x, y), and is the perpendicular distance of the point from the x-axis. Also, we describe it as the distance of this point along the y-axis, from the origin.
How do we Mark X-coordinate on Graph?
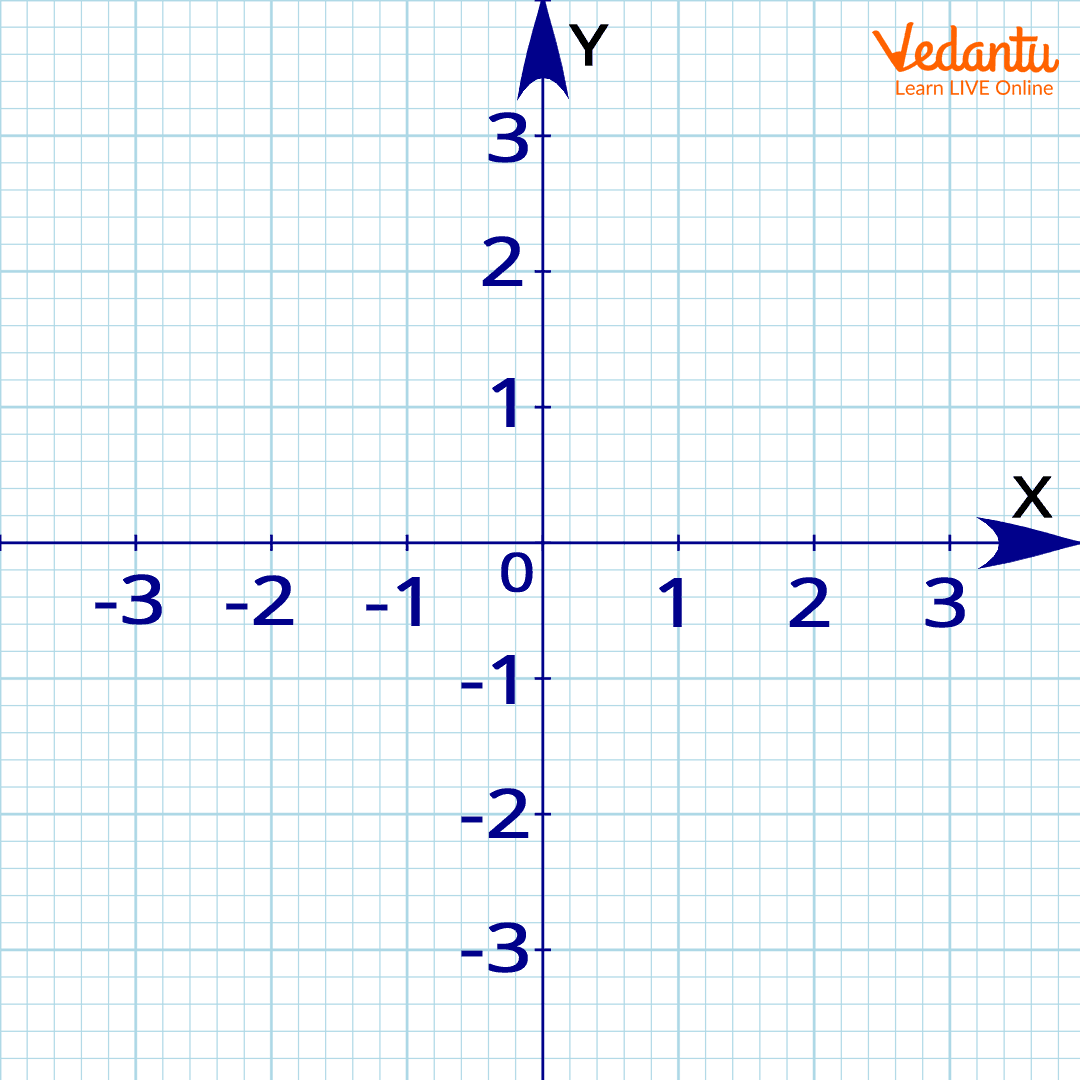
Now, we will see a graph having an x and the y-axis along with the origin.
A graph has four quadrants just like when you fold a paper to form a square and when you unfold it, it forms two lines as you can see below:

x and y coordinates on a graph
Here, the x-axis has points mentioned in blue colour, while the red ones are marked on the y-axis. 0 is the origin and on the x-axis, the right of the origin has positive values from 1 to 5, while to its left, values are negative starting from - 1 to - 5.
Similarly, talking about the y-axis, the points marked above the origin are positive values starting from 1 to 5, while those below the x-axis are negative values starting from - 1 to - 5. Now, let us understand more about the x-coordinate.
Understanding X-Coordinate in Graph

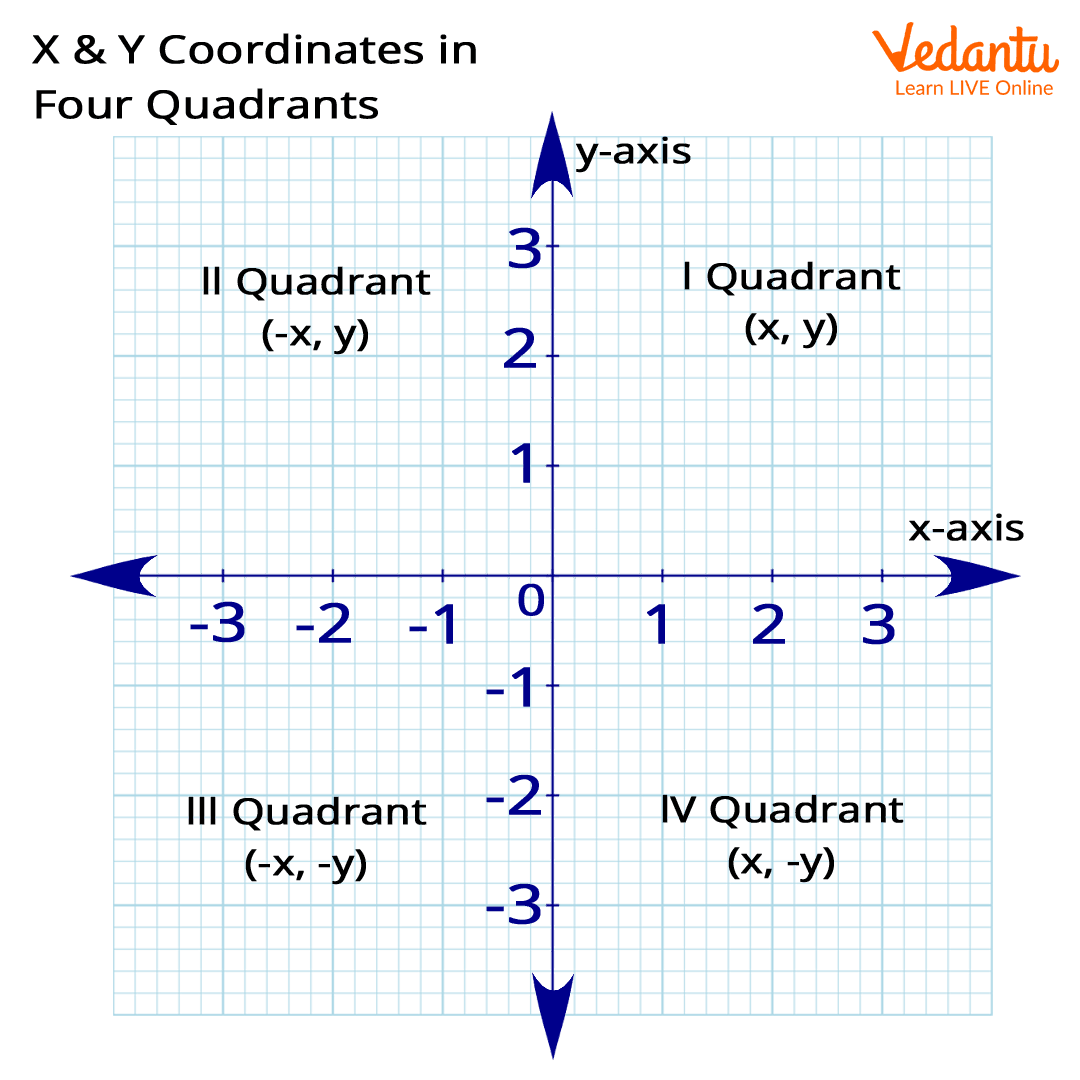
A graph with 4 quadrants
The properties of the x and y coordinates of a point represented in the four quadrants of the coordinate plane are as follows:
The x and y coordinates of the origin are equal to (0, 0), which is the point of intersection of the x-axis and y-axis.
The x coordinate of a point on the x-axis is of the form (a, 0), and here the value corresponding to the y-coordinate is equal to zero.
The point marked in the first quadrant (x, y) has both positive values and is plotted with reference to the positive x-axis and the positive y-axis.
The point marked in the second quadrant is (- x,) with reference to the negative x-axis and positive y-axis.
The point represented in the third quadrant (- x) is plotted with reference to the negative x-axis as it is to the left of the y-axis.
The point marked in the fourth quadrant (x) is plotted with reference to the positive x-axis as it is to the right of the y-axis.
Example of an x-coordinate
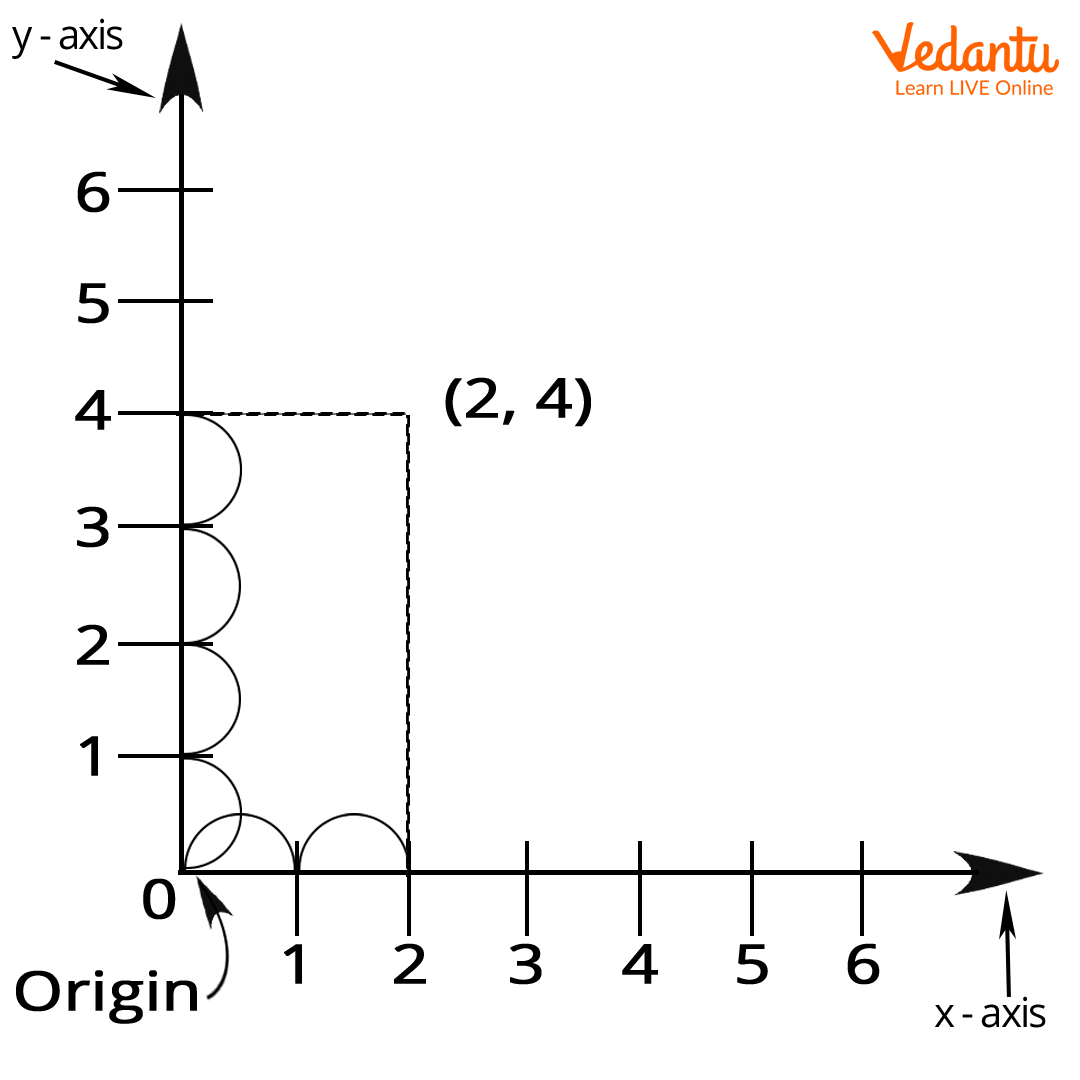
Where does the coordinate (2, 4) go on our 2D graph?

Graph of (2, 4)
The above graph has a coordinate (2, 4). Here, (2, 0) is a point on the x-axis which means y is zero, so the value of the x-coordinate is 2.
From the definition of x coordinate, we understand that the coordinate on the x-axis is (a, 0), where ‘a’ is a point marked on the x-axis and the value of the y-axis remains zero.
FAQs on X-Coordinate: Meaning, Real-Life Applications & Practice
1. What is an x-coordinate in Maths?
The x-coordinate is the first number in an ordered pair (x, y) that specifies a point's location on a Cartesian plane. It represents the point's horizontal distance from the vertical y-axis. A positive x-coordinate means the point is to the right of the y-axis, while a negative x-coordinate means it is to the left.
2. How do you find the x-coordinate of a point on a graph?
To find the x-coordinate of a specific point, you must determine its horizontal position. Start at the point and draw a straight vertical line (a perpendicular line) down or up to the horizontal x-axis. The number where this line intersects the x-axis is the value of the x-coordinate.
3. Can you provide an example of an x-coordinate?
Certainly. In the coordinate pair (7, 3), the x-coordinate is 7. This tells us that the point is located 7 units to the right of the y-axis. Similarly, in the point (-4, 5), the x-coordinate is -4, indicating the point is 4 units to the left of the y-axis.
4. What is the special name for the x-coordinate, and why is it important?
The special technical name for the x-coordinate is the abscissa. The y-coordinate is called the ordinate. Using these precise terms is important in higher-level mathematics to avoid confusion and clearly communicate which coordinate is being referred to when describing positions, functions, and geometric shapes.
5. What is the x-coordinate of any point located on the y-axis?
The x-coordinate of any point located directly on the y-axis is always zero (0). This is because a point on the y-axis has no horizontal displacement; it has not moved to the right or to the left from the origin's horizontal position. For example, the point (0, 5) lies on the y-axis.
6. How does the sign (positive or negative) of an x-coordinate affect a point's position on a graph?
The sign of the x-coordinate determines on which side of the y-axis a point lies. This is a fundamental rule for plotting points correctly on the Cartesian plane.
- A positive x-coordinate (+) places the point in either the first or fourth quadrant (to the right of the y-axis).
- A negative x-coordinate (-) places the point in either the second or third quadrant (to the left of the y-axis).
7. How do the x-coordinate and y-coordinate differ, and why are both needed?
The x-coordinate and y-coordinate differ primarily in the direction they measure:
- The x-coordinate (abscissa) measures the horizontal distance from the y-axis.
- The y-coordinate (ordinate) measures the vertical distance from the x-axis.
Both are essential because a single coordinate only defines a line, not a unique point. You need the x-coordinate to specify the horizontal position and the y-coordinate to specify the vertical position. Together, their intersection (x, y) pinpoints one exact location on a two-dimensional plane.
8. What is the x-coordinate of the origin?
The x-coordinate of the origin is zero (0). The origin is the central point where the x-axis and y-axis intersect, represented by the coordinate pair (0, 0). Therefore, its horizontal position (x-coordinate) and vertical position (y-coordinate) are both zero.


