


Visualizing Equations: Understanding Motion Graphs in Physics
There are three equations of motion that we can use to derive a few physical quantities like initial velocity, final velocity, acceleration, displacement etc. Equations of motion by graphical methods play an important role when we want to derive such physical quantities. The motion of an object can be explained by a graphical method.
Graphical Method To Represent The Motion Of An Object
In the graphical method, we can study the motion of an object with the help of graphical representation of the curve of motion. Three equations of motion can be derived with the help of graphical representation. The first equation of motion is called velocity-time relation, the second equation of motion is called position-time relation and the third equation of motion is known as position-velocity relation.
Equation Of Motion For Velocity-Time Relation
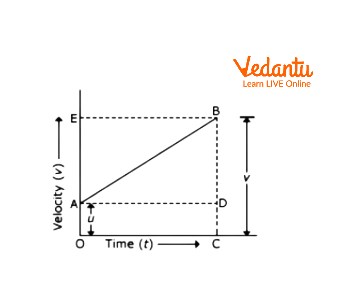
Velocity-Time Graph To Derive First Equation Of Motion
This graph shows that the object is moving with uniform acceleration. Here, we can see that this graph has not started from the origin. This shows that the object has not started from rest. That means, it has some initial velocity. gives us the initial velocity of an object.

Here, = initial velocity = =


= = final velocity =


= time taken by an object to reach at point B =


From the graph,
we can say that,

Therefore,

Acceleration can be calculated by the slope of this graph. So,
Acceleration,

So, in this way, with the help of a graphical method, we can derive the first equation of motion which is also known as velocity-time relation.
Equation Of Motion For Position-Time Relation
From the above figure,
We can calculate the distance travelled by an object.
= Area of


Therefore, = Area of + Area of


=

By substituting,

We will get,

This is the second equation of motion, which is known as position-time relation.
Equation Of Motion For Position-Velocity Relation
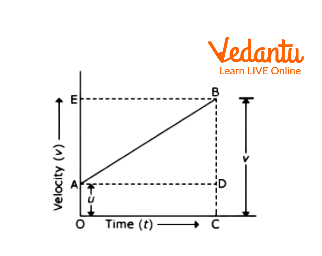
Velocity-Time Graph To Derive Third Equation Of Motion
In order to derive the third equation of motion, we will calculate the displacement of the object from point A to point B.
Here, = initial velocity = =
= = final velocity =
= time taken by an object to at reach point B =
From the graph, we can say that,
displacement = Area under the trapezium


This area will give us the displacement of the object from point A to point B.
Therefore,

Substituting the values, we have,

From the first equation of motion, put the value of in above equation,

We will get,

So, we will get, which is the third equation of motion. In this way, we can derive the third equation of motion by graphical method.

Solved Examples
1. A train starts from rest and accelerate uniformly at the rate of for Calculate the velocity of train in


Ans: Given: Here, a bus is starting from its rest position. So, we can take its initial velocity as

acceleration

time

Here, we will use the relation to find out its velocity,

So,

Hence, the velocity of train would be

2. A ball is gently dropped from a height of If its velocity increases uniformly at the rate of , with what velocity will it strike the ground? After what time will it strike the ground?


Ans: Given: Here, a ball is dropped from a height of
So, its initial velocity can be taken as

height

acceleration

Here, we will use the relation

So,

Therefore,

So, it will strike the ground with the velocity of

Now, we need to find out the value of time

So, we will use the relation


That means, if the ball is released from height, it will strike the ground after


Interesting Facts
Newton was the first scientist who developed laws of motion.
Gravitational forces don’t need to have contact with the objects.
Newton’s second law explains to us that unbalanced force causes acceleration.
Conclusion
The area under velocity versus time graph gives the displacement of the object. The slope of the velocity versus time graph gives us information about acceleration of an object. The physical quantities like distance, velocity, acceleration are related to each other in a certain way. These kinds of relations between these physical quantities are necessary to understand the behaviour of an object. So, graphical representation of motion plays an important role in Physics.
FAQs on Equations of Motion by Graphical Method: A Complete Guide
1. What are the three main equations of motion that can be derived using the graphical method?
The three fundamental equations of motion for an object moving with uniform acceleration, as derived by the graphical method, are:
- First Equation (Velocity-Time Relation): v = u + at
- Second Equation (Position-Time Relation): s = ut + ½at²
- Third Equation (Position-Velocity Relation): v² = u² + 2as
Here, 'u' is the initial velocity, 'v' is the final velocity, 'a' is the uniform acceleration, 't' is the time, and 's' is the displacement.
2. How is the first equation of motion, v = u + at, derived from a velocity-time graph?
The first equation of motion is derived using the slope of a velocity-time (v-t) graph. For an object with uniform acceleration, the v-t graph is a straight line. The slope of this line represents acceleration (a). It is calculated as the change in velocity (v - u) divided by the change in time (t). Therefore, a = (v - u) / t. Rearranging this formula gives the first equation of motion: v = u + at.
3. What does the area under a velocity-time graph represent, and how does it help derive the second equation of motion?
The area under a velocity-time graph represents the displacement (s) of the object. To derive the second equation of motion (s = ut + ½at²), this area is calculated by splitting it into a rectangle and a triangle.
- The area of the rectangle is u × t (initial velocity × time).
- The area of the triangle is ½ × base × height, which is ½ × t × (v - u).
Since we know from the first equation that (v - u) = at, we can substitute this to get: s = ut + ½(t)(at), which simplifies to s = ut + ½at².
4. How is the third equation of motion, v² = u² + 2as, derived graphically?
The third equation of motion is also derived by calculating the displacement (s) from the area under the velocity-time graph. However, instead of splitting the area, we consider it as a single shape: a trapezium. The area of a trapezium is given by ½ × (sum of parallel sides) × height. In the v-t graph, the parallel sides are the initial velocity (u) and final velocity (v), and the height is time (t). So, s = ½ × (u + v) × t. We then substitute t from the first equation (t = (v-u)/a). This gives s = ½ × (v + u) × (v - u)/a, which simplifies to 2as = v² - u², or v² = u² + 2as.
5. What is the most important condition that must be met to apply the equations of motion derived by the graphical method?
The single most important condition for these equations to be valid is that the object must be moving with constant or uniform acceleration. If the acceleration is changing, the velocity-time graph will not be a straight line, and these simple geometric derivations (and the equations themselves) will no longer apply. The motion is also assumed to be along a straight line.
6. Why is the graphical method for deriving equations of motion taught before the calculus method?
The graphical method is taught first, typically in Class 9, because it provides a very intuitive and visual understanding of the relationships between velocity, time, acceleration, and displacement. It connects abstract formulae to concrete geometric shapes (lines, rectangles, triangles). This builds a strong conceptual foundation before students are introduced to the more abstract and mathematically rigorous calculus method in Class 11, which uses differentiation and integration to derive the same results.
7. Can the graphical method be used for an object starting from rest and one already in motion?
Yes, the graphical method works for both scenarios.
- If an object starts from rest, its initial velocity 'u' is zero. The velocity-time graph will start from the origin (0,0).
- If an object is already in motion, its initial velocity 'u' has a non-zero value. The graph will start from a point higher up on the y-axis (at u) instead of the origin.
The method of calculating the slope and area remains the same in both cases, correctly accounting for the initial conditions.