


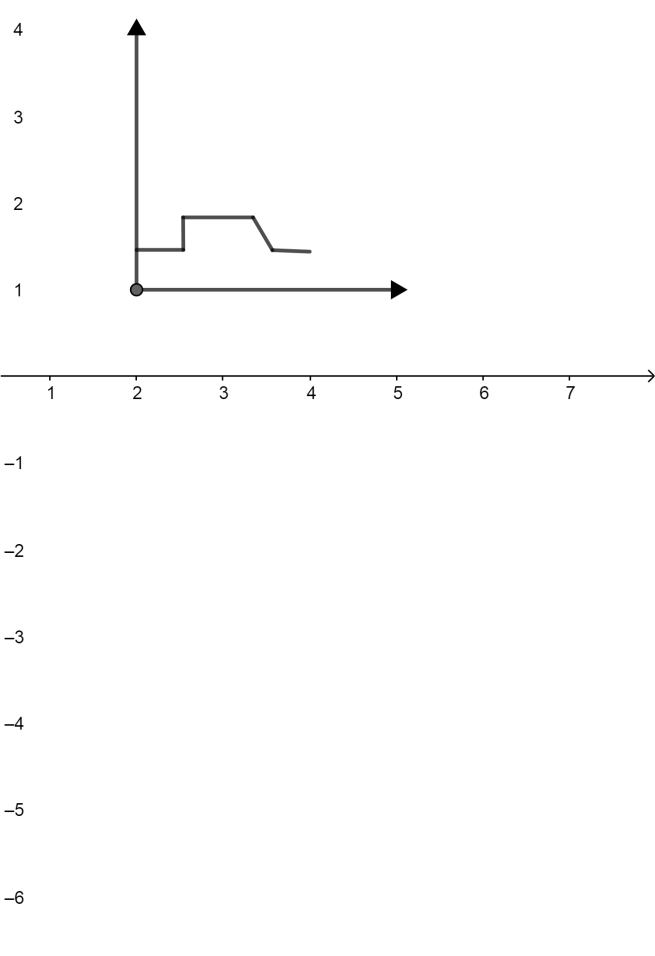
A bus travels from point $A$ to point $B$. The bus starts out going slowly and then drives faster. Traffic is then at a total standstill due to an accident. The bus continues at a faster speed. The bus reaches point of $B$. Select from the following graphs, that could represent the bus’s distance from point $A$, as a function of time.
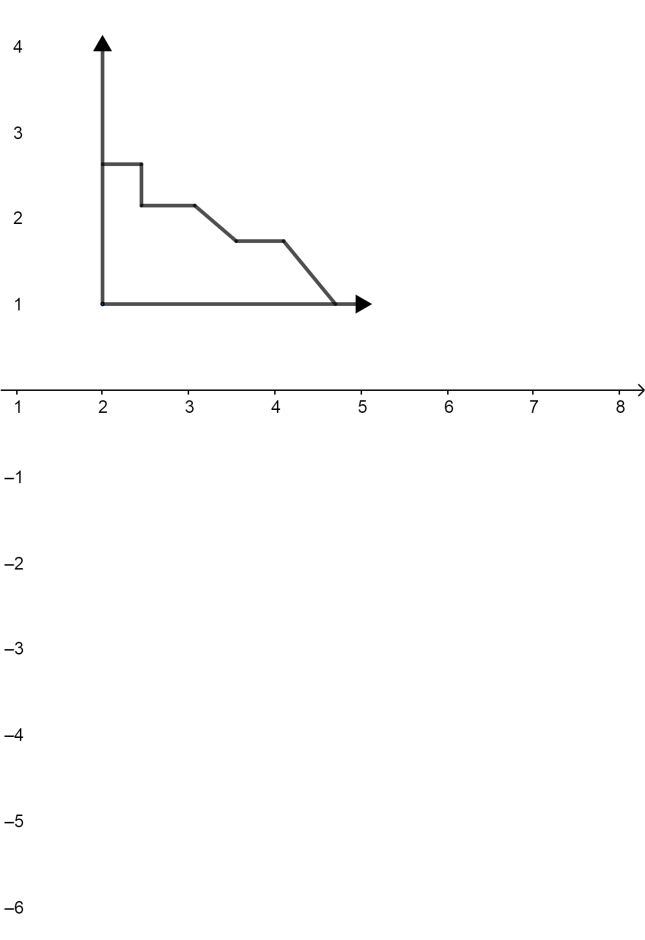
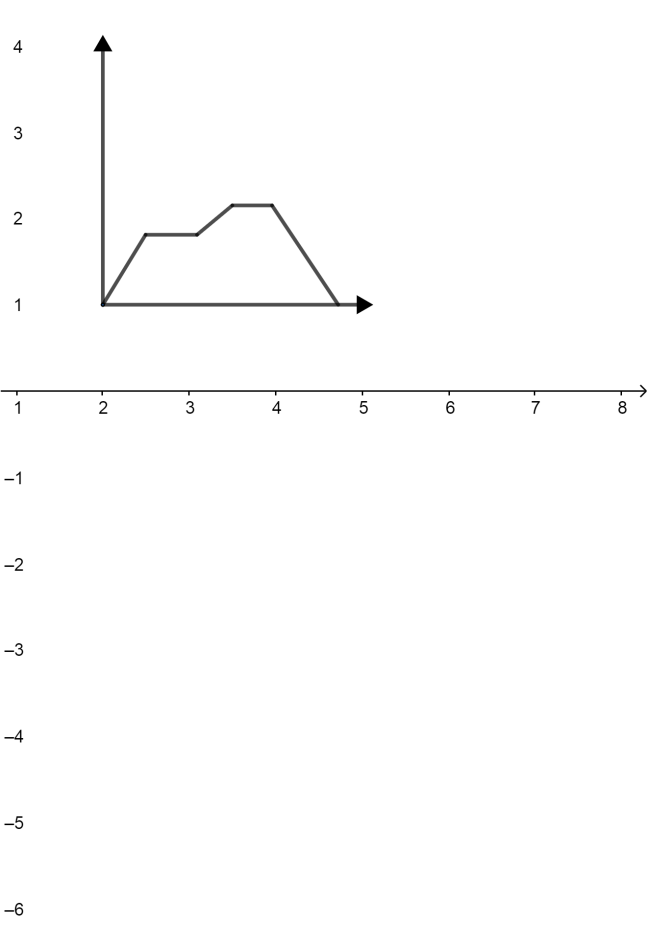
A. B. C.

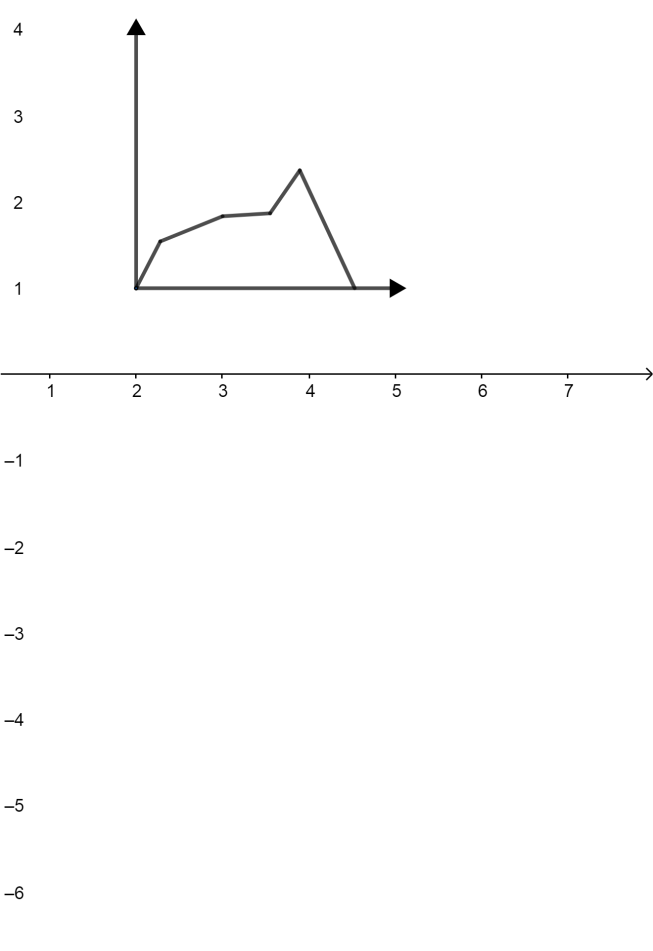
D. E.
Answer
585.6k+ views
Hint: For this question analyze the conditions given in the question and plot and draw the lines according to different types of speed given in the questions for example: for the slower speeds mark an increasing line with a low slope and when it says for a higher speed draw a line with higher slope and for constant speed draw a parallel line to the x-axis.
Complete step by step answer:
It is given that the bus starts slowly in the starting so for that we will just plot the graph with a low slope line and then it is given that the bus goes faster so for that we will draw a line with a higher slope. Now it is given that due to traffic bus is at a total standstill that means it doesn’t move and is constant so we will plot a straight line parallel to the x-axis, again it moves at a faster speed so we will draw an increasing curve and after it reaches the final point we will draw a straight line to demonstrate the constant speed parallel to the x-axis.
So, the graph will look like:
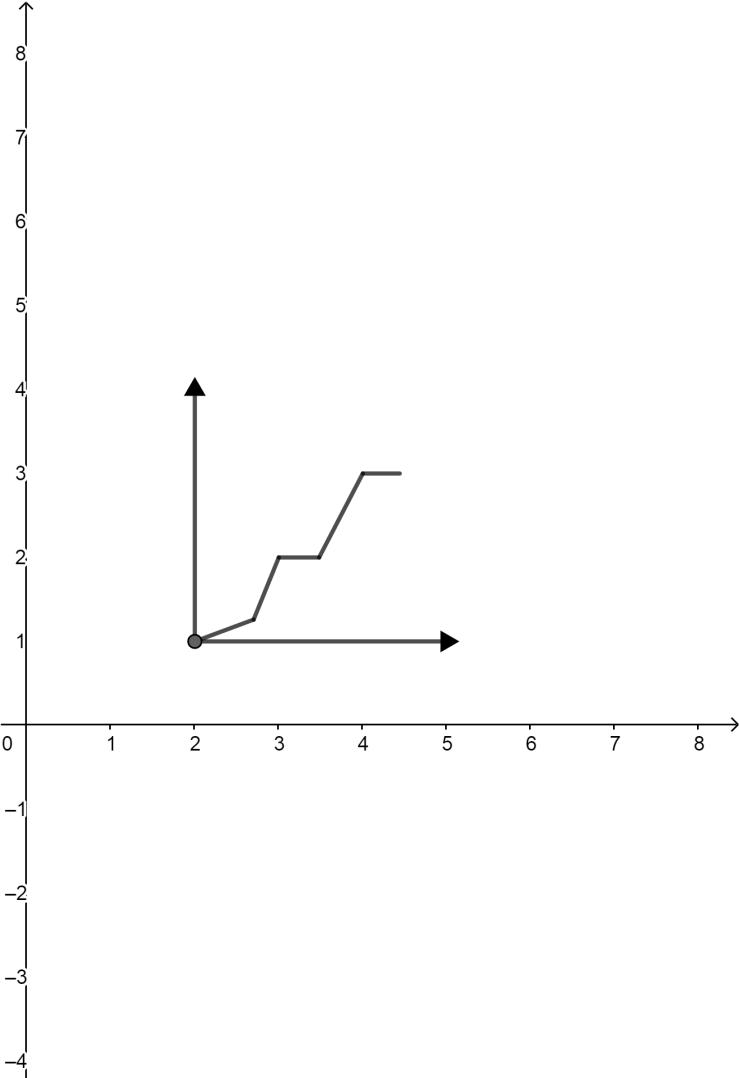
Hence, option A is correct.
Note:
Since there are no values therefore we assume the slopes and draw a comparative graph that means the faster speed will be marked as a steeper slope than that of the slower speed. Always use a scale while drawing graphs.
Complete step by step answer:
It is given that the bus starts slowly in the starting so for that we will just plot the graph with a low slope line and then it is given that the bus goes faster so for that we will draw a line with a higher slope. Now it is given that due to traffic bus is at a total standstill that means it doesn’t move and is constant so we will plot a straight line parallel to the x-axis, again it moves at a faster speed so we will draw an increasing curve and after it reaches the final point we will draw a straight line to demonstrate the constant speed parallel to the x-axis.
So, the graph will look like:
Hence, option A is correct.
Note:
Since there are no values therefore we assume the slopes and draw a comparative graph that means the faster speed will be marked as a steeper slope than that of the slower speed. Always use a scale while drawing graphs.
Recently Updated Pages
Master Class 10 Computer Science: Engaging Questions & Answers for Success
Master Class 10 General Knowledge: Engaging Questions & Answers for Success
Master Class 10 English: Engaging Questions & Answers for Success
Master Class 10 Social Science: Engaging Questions & Answers for Success
Master Class 10 Maths: Engaging Questions & Answers for Success
Master Class 10 Science: Engaging Questions & Answers for Success
Trending doubts
What is the median of the first 10 natural numbers class 10 maths CBSE
Which women's tennis player has 24 Grand Slam singles titles?
Who is the Brand Ambassador of Incredible India?
Why is there a time difference of about 5 hours between class 10 social science CBSE
Write a letter to the principal requesting him to grant class 10 english CBSE
A moving boat is observed from the top of a 150 m high class 10 maths CBSE