


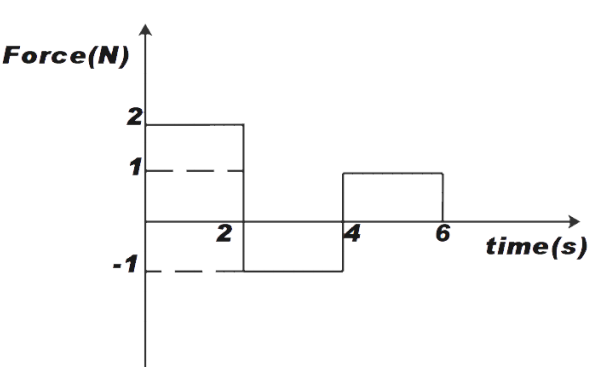
A Force time graph for a linear momentum is shown in figure. The linear momentum gained between 0 and 6 seconds is:
A. 2 Ns
B. 4 Ns
C. 6 Ns
D. zero
Answer
579.9k+ views
Hint: This question asks us to calculate the linear momentum from the given figure. To calculate the linear momentum, we will be finding the area under the curve of the given Force –Time graph, since the area under the curve of force-time gives the momentum.
Complete step-by-step answer:
We know that the values above the X- axis are taken as positive and below it, are taken as negative. From the given figure, we can say that, in the first two seconds the force applied is +2 N, the force applied in the next two seconds i.e. 2 - 4 seconds is -1 N and the last two seconds i.e. 4-6 seconds the force applied is +1 N.
We know the momentum is given by the area under the force time curve. The area in every two second interval seems like a rectangle.
Therefore, area for first two seconds is \[{{a}_{1}}\]
\[{{a}_{1}}=2\times 2\]
\[{{a}_{1}}\] = 4 Ns …………. (1)
Similarly, area for next two seconds is \[{{a}_{2}}\]
\[{{a}_{2}}=2\times (-1)\]
\[{{a}_{2}}\] = -2 Ns …………. (2)
The area for last two seconds is \[{{a}_{3}}\]
\[{{a}_{3}}=2\times 1\]
\[{{a}_{3}}\] = 2 Ns ………………. (3)
Now, the total area under the curve will be given by addition of (1), (2) and (3)
Therefore,
A = \[{{a}_{1}}\]+\[{{a}_{2}}\]+\[{{a}_{3}}\]
A = 4 + (-2) + 2
Therefore,
A = 4 Ns
So, the correct answer is “Option B”.
Note: We know that in a force time graph, force is given on Y- axis and time is given X- axis. In a force time graph the slope does not matter. But, the area under force-time is very important. The area under force-time is force multiplied by time, which gives us the quantity called impulse. We know that impulse is a change in momentum of the object. So, we can calculate momentum from a force-time graph.
Recently Updated Pages
Master Class 11 Computer Science: Engaging Questions & Answers for Success
Master Class 11 Business Studies: Engaging Questions & Answers for Success
Master Class 11 Economics: Engaging Questions & Answers for Success
Master Class 11 English: Engaging Questions & Answers for Success
Master Class 11 Maths: Engaging Questions & Answers for Success
Master Class 11 Biology: Engaging Questions & Answers for Success
Trending doubts
One Metric ton is equal to kg A 10000 B 1000 C 100 class 11 physics CBSE
There are 720 permutations of the digits 1 2 3 4 5 class 11 maths CBSE
Discuss the various forms of bacteria class 11 biology CBSE
Draw a diagram of a plant cell and label at least eight class 11 biology CBSE
State the laws of reflection of light
Explain zero factorial class 11 maths CBSE