


A group of 360 people was asked to vote for their favorite season from the three seasons rainy, winter, and summer.
i) Which season got the most votes?
ii) Find the central angle of each sector.
iii) Draw a pie chart to show this information.
Season No. of votes Summer 90 Rainy 120 Winter 150
| Season | No. of votes |
| Summer | 90 |
| Rainy | 120 |
| Winter | 150 |
Answer
552.9k+ views
Hint: For part (i), find the season who got the maximum number of votes from the table. For part (ii), find the total number of votes. Then divide each season vote by total votes and multiply it by $360^\circ $ to get the central angle of each sector. For part (iii), draw a circle and use a protractor to draw the angles of each season.
Complete Step by Step Solution:
(i)
Since the number of votes for winter is 150 which is highest among all three seasons.
Hence, winter got the most votes.
(ii)
To calculate the total number of votes, add votes of all the seasons,
$ \Rightarrow $Total vote $ = 90 + 120 + 150$
Add the terms on the right side,
$\therefore $ Total vote = $360$
Divide votes of each season vote with 360 and multiply it by 360.
For the summer season,
$ \Rightarrow $ Central Angle $ = \dfrac{{90}}{{360}} \times 360^\circ $
Cancel out the common term,
$ \Rightarrow $ Central Angle $ = 90^\circ $
For the rainy season,
$ \Rightarrow $ Central Angle $ = \dfrac{{120}}{{360}} \times 360^\circ $
Cancel out the common term,
$ \Rightarrow $ Central Angle $ = 120^\circ $
For the winter season,
$ \Rightarrow $ Central Angle $ = \dfrac{{150}}{{360}} \times 360^\circ $
Cancel out the common term,
$ \Rightarrow $ Central Angle $ = 150^\circ $
Hence, the central angle for summer is $90^\circ $, for rainy is $120^\circ $ and for winter is $150^\circ $.
(iii)
Draw a circle with a certain radius and mark its center.
Draw a radius at any point on the circle and using this radius of the circle as the base of the protractor, marks $150^\circ $ which is the highest angle on it, and name it.
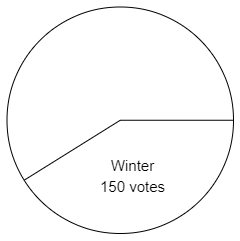
Using the radius, mark the next highest angle, and name them.
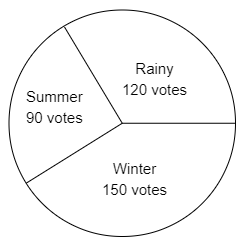
Note: A pie-chart is a representation of data in a circle that is divided into several sections. Each division in the circle represents a proportion of the whole data. In general, every division of the circle is highlighted in a particular color and has a percentage and item heading labeled for it.
Complete Step by Step Solution:
(i)
Since the number of votes for winter is 150 which is highest among all three seasons.
Hence, winter got the most votes.
(ii)
To calculate the total number of votes, add votes of all the seasons,
$ \Rightarrow $Total vote $ = 90 + 120 + 150$
Add the terms on the right side,
$\therefore $ Total vote = $360$
Divide votes of each season vote with 360 and multiply it by 360.
For the summer season,
$ \Rightarrow $ Central Angle $ = \dfrac{{90}}{{360}} \times 360^\circ $
Cancel out the common term,
$ \Rightarrow $ Central Angle $ = 90^\circ $
For the rainy season,
$ \Rightarrow $ Central Angle $ = \dfrac{{120}}{{360}} \times 360^\circ $
Cancel out the common term,
$ \Rightarrow $ Central Angle $ = 120^\circ $
For the winter season,
$ \Rightarrow $ Central Angle $ = \dfrac{{150}}{{360}} \times 360^\circ $
Cancel out the common term,
$ \Rightarrow $ Central Angle $ = 150^\circ $
Hence, the central angle for summer is $90^\circ $, for rainy is $120^\circ $ and for winter is $150^\circ $.
(iii)
Draw a circle with a certain radius and mark its center.
Draw a radius at any point on the circle and using this radius of the circle as the base of the protractor, marks $150^\circ $ which is the highest angle on it, and name it.
Using the radius, mark the next highest angle, and name them.
Note: A pie-chart is a representation of data in a circle that is divided into several sections. Each division in the circle represents a proportion of the whole data. In general, every division of the circle is highlighted in a particular color and has a percentage and item heading labeled for it.
Recently Updated Pages
Master Class 11 Computer Science: Engaging Questions & Answers for Success
Master Class 11 Business Studies: Engaging Questions & Answers for Success
Master Class 11 Economics: Engaging Questions & Answers for Success
Master Class 11 English: Engaging Questions & Answers for Success
Master Class 11 Maths: Engaging Questions & Answers for Success
Master Class 11 Biology: Engaging Questions & Answers for Success
Trending doubts
One Metric ton is equal to kg A 10000 B 1000 C 100 class 11 physics CBSE
There are 720 permutations of the digits 1 2 3 4 5 class 11 maths CBSE
Discuss the various forms of bacteria class 11 biology CBSE
Draw a diagram of a plant cell and label at least eight class 11 biology CBSE
State the laws of reflection of light
10 examples of friction in our daily life