


A longer, wider, and symmetrical Maxwell-Boltzmann distribution suggests which of the following?
A. Most of the molecules being examined have the same speed
B. There is a wide distribution of speeds among the molecules being examined.
C. There is a greater proportion of molecules with a high speed than with a low speed.
D. There is a greater proportion of molecules with a low speed than with a high speed.
Answer
566.7k+ views
Hint: A Maxwell-Boltzmann distribution curve is a probability distribution which tells us the number of molecules ( y axis) per unit speed ( x axis). The total area encompassed is the total number of molecules in the gas.
Formula used:
$K = \dfrac{1}{2}m{v^2}$ where $K$ represents Kinetic energy, $m$ is mass and $v$ is velocity.
Complete step by step answer:
The Maxwell-Boltzmann distribution is many a times represented with the graph given below:
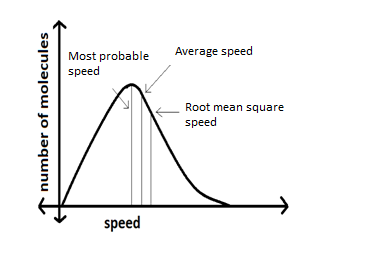
In the Maxwell distribution curve the peak represents the most probable speed which is more likely than any other speed in the curve. When the curve is only wide the difference between the most probable speed, average speed and root mean square speeds would be quite noticeable leading to wide distribution of speed (the relative maximum shifting to the right). This is caused when the temperature of the gas system is increased which causes kinetic energy to increase.
When the graph is only long, it will get elongated along the y axis showing that more number of molecules will have a higher speed than low speed. Whereas if the curve were shorter more will have a slower speed. Larger molecular weights lead to narrowing the velocity distribution, this is because all the particles will have the same kinetic energy at the same temperature. Therefore, as per the kinetic energy equation $K = \dfrac{1}{2}m{v^2}$ the fraction of particles with higher velocities will increase as the molecular weight decreases.
In the question it is said that the curve is long, wide as well as symmetrical which will thus cause the speed distribution to be symmetrical as well and hence most of the molecules which are being examined will have the same speed.
Hence answer is Option A- Most of the molecules being examined have the same speed.
Note:
It is important to remember that as the gas gets colder, the graph would become taller and narrower and the same way, if it gets hotter, there will be shortening and widening of the graph. This will make the area constant.
Formula used:
$K = \dfrac{1}{2}m{v^2}$ where $K$ represents Kinetic energy, $m$ is mass and $v$ is velocity.
Complete step by step answer:
The Maxwell-Boltzmann distribution is many a times represented with the graph given below:
In the Maxwell distribution curve the peak represents the most probable speed which is more likely than any other speed in the curve. When the curve is only wide the difference between the most probable speed, average speed and root mean square speeds would be quite noticeable leading to wide distribution of speed (the relative maximum shifting to the right). This is caused when the temperature of the gas system is increased which causes kinetic energy to increase.
When the graph is only long, it will get elongated along the y axis showing that more number of molecules will have a higher speed than low speed. Whereas if the curve were shorter more will have a slower speed. Larger molecular weights lead to narrowing the velocity distribution, this is because all the particles will have the same kinetic energy at the same temperature. Therefore, as per the kinetic energy equation $K = \dfrac{1}{2}m{v^2}$ the fraction of particles with higher velocities will increase as the molecular weight decreases.
In the question it is said that the curve is long, wide as well as symmetrical which will thus cause the speed distribution to be symmetrical as well and hence most of the molecules which are being examined will have the same speed.
Hence answer is Option A- Most of the molecules being examined have the same speed.
Note:
It is important to remember that as the gas gets colder, the graph would become taller and narrower and the same way, if it gets hotter, there will be shortening and widening of the graph. This will make the area constant.
Recently Updated Pages
Master Class 12 Economics: Engaging Questions & Answers for Success
Master Class 12 Physics: Engaging Questions & Answers for Success
Master Class 12 English: Engaging Questions & Answers for Success
Master Class 12 Social Science: Engaging Questions & Answers for Success
Master Class 12 Maths: Engaging Questions & Answers for Success
Master Class 12 Business Studies: Engaging Questions & Answers for Success
Trending doubts
Which are the Top 10 Largest Countries of the World?
What are the major means of transport Explain each class 12 social science CBSE
Draw a labelled sketch of the human eye class 12 physics CBSE
Why cannot DNA pass through cell membranes class 12 biology CBSE
Differentiate between insitu conservation and exsitu class 12 biology CBSE
Draw a neat and well labeled diagram of TS of ovary class 12 biology CBSE