What are some examples of bounded functions?
Answer
524.4k+ views
Hint: Before writing the examples of bounded functions, bounded function is a function that is bounded by some range, i.e. $ a \leqslant f\left( x \right) \leqslant b $ . We have discussed the definition of bounded functions and their examples in detail below.
Complete step by step solution:
In this question, we are going to see what bounded functions are and see their examples.
First of all, let us see what bounded functions are.
The functions that have at least one pair of a and b such that the range of that function lies between a and b is known as a bounded function. The name itself explains that the functions bounded by some range are called bounded functions.
$ a \leqslant f\left( x \right) \leqslant b $ , where $ a,b \in R $ .
The greatest value of $ a $ is known as the Greatest Least Bound (GLB) and the lowest value of $ b $ is known as the Least Upper Bound (LUB).
For example: $ - 10 \leqslant \sin x \leqslant 5000 $ . Here, we can see that $ \sin x $ is a bounded function.
Now, there can be infinite values for a and b, but the minimum value of $ \sin x $ is $ - 1 $ and the maximum value of $ \sin x $ is $ 1 $ .
Thus, GLB $ = - 1 $ and LUB $ = 1 $ .
Some commonly used examples of bounded functions are:
$ \sin x $ , $ \cos x $ , $ {\tan ^{ - 1}}x $ , $ \dfrac{1}{{1 + {e^x}}} $ and $ \dfrac{1}{{1 + {x^2}}} $ .
All these functions are bounded functions.
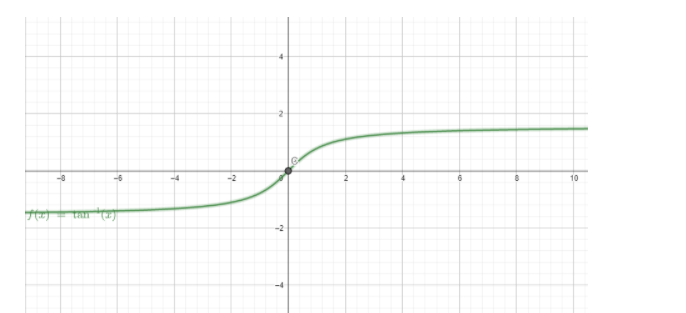
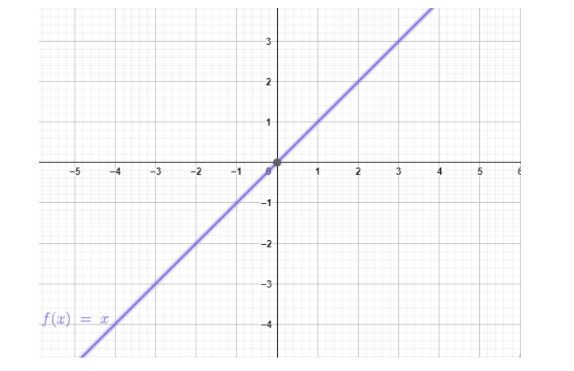
Note: The graph of a bounded function stays within the horizontal axis, while the graph of unbounded function does not. The graph of one bounded function and one unbounded function is shown below.

The above graph is an example of bounded function. Here, $ f\left( x \right) = {\tan ^{ - 1}}x $ . Here, we can see that the graph remains within the horizontal axis.

The above graph is an example of unbounded function. Here, $ f\left( x \right) = x $ . Here, we can see that the graph does not remain within the horizontal axis.
Complete step by step solution:
In this question, we are going to see what bounded functions are and see their examples.
First of all, let us see what bounded functions are.
The functions that have at least one pair of a and b such that the range of that function lies between a and b is known as a bounded function. The name itself explains that the functions bounded by some range are called bounded functions.
$ a \leqslant f\left( x \right) \leqslant b $ , where $ a,b \in R $ .
The greatest value of $ a $ is known as the Greatest Least Bound (GLB) and the lowest value of $ b $ is known as the Least Upper Bound (LUB).
For example: $ - 10 \leqslant \sin x \leqslant 5000 $ . Here, we can see that $ \sin x $ is a bounded function.
Now, there can be infinite values for a and b, but the minimum value of $ \sin x $ is $ - 1 $ and the maximum value of $ \sin x $ is $ 1 $ .
Thus, GLB $ = - 1 $ and LUB $ = 1 $ .
Some commonly used examples of bounded functions are:
$ \sin x $ , $ \cos x $ , $ {\tan ^{ - 1}}x $ , $ \dfrac{1}{{1 + {e^x}}} $ and $ \dfrac{1}{{1 + {x^2}}} $ .
All these functions are bounded functions.
Note: The graph of a bounded function stays within the horizontal axis, while the graph of unbounded function does not. The graph of one bounded function and one unbounded function is shown below.

The above graph is an example of bounded function. Here, $ f\left( x \right) = {\tan ^{ - 1}}x $ . Here, we can see that the graph remains within the horizontal axis.

The above graph is an example of unbounded function. Here, $ f\left( x \right) = x $ . Here, we can see that the graph does not remain within the horizontal axis.
Recently Updated Pages
Master Class 10 Computer Science: Engaging Questions & Answers for Success

Master Class 10 General Knowledge: Engaging Questions & Answers for Success

Master Class 10 English: Engaging Questions & Answers for Success

Master Class 10 Social Science: Engaging Questions & Answers for Success

Master Class 10 Maths: Engaging Questions & Answers for Success

Master Class 10 Science: Engaging Questions & Answers for Success

Trending doubts
What is the median of the first 10 natural numbers class 10 maths CBSE

Which women's tennis player has 24 Grand Slam singles titles?

Who is the Brand Ambassador of Incredible India?

Why is there a time difference of about 5 hours between class 10 social science CBSE

Write a letter to the principal requesting him to grant class 10 english CBSE

A moving boat is observed from the top of a 150 m high class 10 maths CBSE


