


Determine the graph of the equation \[y = 2x - 3\] ?
Answer
491.1k+ views
Hint: To determine the graph we need different \[x\] values as well as their corresponding values of \[y\]. To solve this question, we take any value of \[x\] and then find the corresponding value of \[y\] and vice versa. In this way, we find two points and plot them on the graph and join them in order to get the graph of the equation.
Complete answer:
Given equation is \[y = 2x - 3\]
To plot a graph of the given equation \[y = 2x - 3\], we need points.
To find the first point let us put \[x = 0\] and find the corresponding value of \[y\].
On putting the value \[x = 0\] in the given equation.
\[y = 2 \times 0 - 3\]
On simplifying we get the value of \[y\]
\[ \Rightarrow y = - 3\]
This means when $x=0$, the value of $y$ on the graph is $-3$. On observing the values of \[x\] and \[y\] we get the first point.
\[A\] be the first point. \[A = \left( {0, - 3} \right)\]
To find the second point we put \[y = 0\] and find the corresponding value of \[x\].
On putting the value \[y = 0\] in the given equation.
\[0 = 2 \times x - 3\]
On taking 3 to another side
\[2 \times x = 3\]
On simplifying we get the value of \[x\]
\[ \Rightarrow x = \dfrac{3}{2}\]
\[ \Rightarrow x = 1.5\]
On observing the values of \[x\] and \[y\] we get the second point.
\[B\] be the first point. \[B = \left( {1.5,0} \right)\]
Now we make a table of these points.
Now we put these points in the graph and join them to obtain the graph of the equation.
On putting these points in the graph. The graph looks like-
Note:
To plot the graph of the linear equation we need a minimum of two points but we are unable to make a line with a single point. More points are required if we make a curve then more points are required and with more points, our curve is more accurate.
Complete answer:
Given equation is \[y = 2x - 3\]
To plot a graph of the given equation \[y = 2x - 3\], we need points.
To find the first point let us put \[x = 0\] and find the corresponding value of \[y\].
On putting the value \[x = 0\] in the given equation.
\[y = 2 \times 0 - 3\]
On simplifying we get the value of \[y\]
\[ \Rightarrow y = - 3\]
This means when $x=0$, the value of $y$ on the graph is $-3$. On observing the values of \[x\] and \[y\] we get the first point.
\[A\] be the first point. \[A = \left( {0, - 3} \right)\]
To find the second point we put \[y = 0\] and find the corresponding value of \[x\].
On putting the value \[y = 0\] in the given equation.
\[0 = 2 \times x - 3\]
On taking 3 to another side
\[2 \times x = 3\]
On simplifying we get the value of \[x\]
\[ \Rightarrow x = \dfrac{3}{2}\]
\[ \Rightarrow x = 1.5\]
On observing the values of \[x\] and \[y\] we get the second point.
\[B\] be the first point. \[B = \left( {1.5,0} \right)\]
Now we make a table of these points.
| \[x\] | \[y\] |
| 0 | -3 |
| 1.5 | 0 |
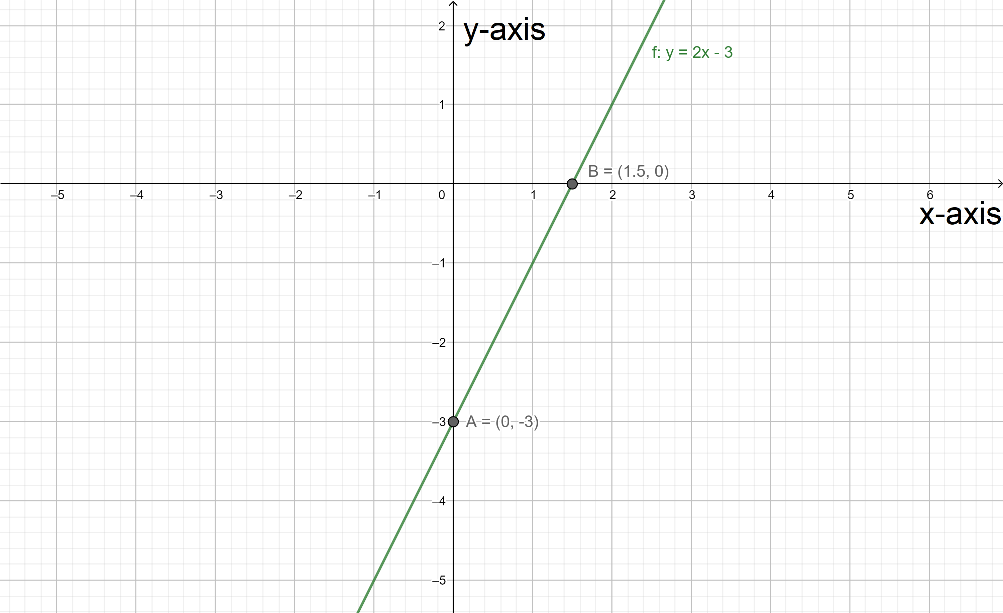
Now we put these points in the graph and join them to obtain the graph of the equation.
On putting these points in the graph. The graph looks like-
Note:
To plot the graph of the linear equation we need a minimum of two points but we are unable to make a line with a single point. More points are required if we make a curve then more points are required and with more points, our curve is more accurate.
Recently Updated Pages
Master Class 11 Computer Science: Engaging Questions & Answers for Success
Master Class 11 Business Studies: Engaging Questions & Answers for Success
Master Class 11 Economics: Engaging Questions & Answers for Success
Master Class 11 English: Engaging Questions & Answers for Success
Master Class 11 Maths: Engaging Questions & Answers for Success
Master Class 11 Biology: Engaging Questions & Answers for Success
Trending doubts
One Metric ton is equal to kg A 10000 B 1000 C 100 class 11 physics CBSE
There are 720 permutations of the digits 1 2 3 4 5 class 11 maths CBSE
Discuss the various forms of bacteria class 11 biology CBSE
Draw a diagram of a plant cell and label at least eight class 11 biology CBSE
State the laws of reflection of light
Explain zero factorial class 11 maths CBSE