


What is the difference between the graph of exponential growth function and exponential Decay function?
Answer
525.9k+ views
Hint: To solve the question like this we need to have the knowledge of exponential decay function and exponential growth function. Exponential growth functions are basically that kind of function which increases exponentially with time while in case of exponential decay function these are the functions which actually decrease with time.
Complete step-by-step solution:
The question asks us to differentiate between the exponential growth function and exponential decay function graphs. Exponential growth function is defined as the way, when the number of some entity increases rapidly in exponential manner over the time. Ancient growth mathematical function is one such exponential function in which numbers multiply in size as time progresses. The representation of the above explanation in form of the graph is shown below:
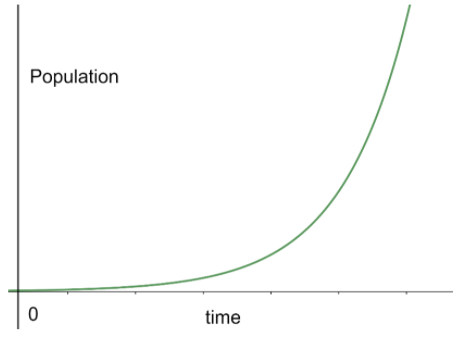
The above graph increases with the time. The graph at $\text{time =0}$ is near to the time axis and as the time is increasing the population is increasing with the time exponentially.
We can define Decay function as the function in which the numbers decrease over the time in exponential function. The representation of the above explanation in form of the graph is shown below:
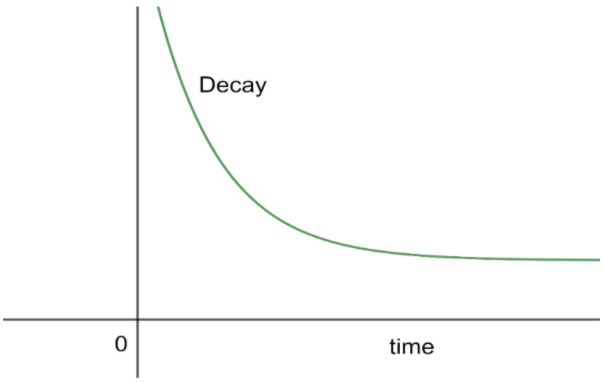
The above graph decreases with the time. The graph at the $\text{time=0}$ is away from the time axis and as the time is increasing the y- coordinates are decreasing with the time exponentially.
Note: The trend that is evident in exponential growth is increasingly large numbers over time. The trend in decay is the reverse of that seen with exponential growth and instead, it is increasingly small numbers over time.
Complete step-by-step solution:
The question asks us to differentiate between the exponential growth function and exponential decay function graphs. Exponential growth function is defined as the way, when the number of some entity increases rapidly in exponential manner over the time. Ancient growth mathematical function is one such exponential function in which numbers multiply in size as time progresses. The representation of the above explanation in form of the graph is shown below:
The above graph increases with the time. The graph at $\text{time =0}$ is near to the time axis and as the time is increasing the population is increasing with the time exponentially.
We can define Decay function as the function in which the numbers decrease over the time in exponential function. The representation of the above explanation in form of the graph is shown below:
The above graph decreases with the time. The graph at the $\text{time=0}$ is away from the time axis and as the time is increasing the y- coordinates are decreasing with the time exponentially.
Note: The trend that is evident in exponential growth is increasingly large numbers over time. The trend in decay is the reverse of that seen with exponential growth and instead, it is increasingly small numbers over time.
Recently Updated Pages
Master Class 11 Computer Science: Engaging Questions & Answers for Success
Master Class 11 Business Studies: Engaging Questions & Answers for Success
Master Class 11 Economics: Engaging Questions & Answers for Success
Master Class 11 English: Engaging Questions & Answers for Success
Master Class 11 Maths: Engaging Questions & Answers for Success
Master Class 11 Biology: Engaging Questions & Answers for Success
Trending doubts
One Metric ton is equal to kg A 10000 B 1000 C 100 class 11 physics CBSE
There are 720 permutations of the digits 1 2 3 4 5 class 11 maths CBSE
Discuss the various forms of bacteria class 11 biology CBSE
Draw a diagram of a plant cell and label at least eight class 11 biology CBSE
State the laws of reflection of light
Explain zero factorial class 11 maths CBSE