


What is the distance time graph? What are its uses?
Answer
564.9k+ views
Hint: A distance time graph, just as the name suggests is a graph that can be plotted between distance and time. Distance should always be plotted on the Y-axis while time is always plotted on the X-axis. Finding the slope of this graph can get you the magnitude of velocity of the body.
Formulas used: We will be using the formula, $v = \dfrac{d}{t}$ where $v$ is speed, $d$ is the distance travelled by the body, and $t$ denotes time. Also Slope of a graph can be found by using $slope = \dfrac{{{Y_2} - {Y_1}}}{{{X_2} - {X_1}}}$ .
Complete Step by step answer
A motion graph is a two-dimensional graph between any 2 quantities that can define the motion of the object. Usually time is used as the basic and fixed component and is plotted on the X-axis. The Y-axis can have variable quantities like Distance, velocity, or acceleration.
When the Y-axis of a motion graph is plotted with distance then the graph is called distance graph. And this is how a distance-time graph looks like.
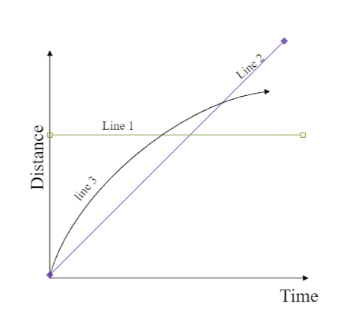
In the Above graph you can clearly see that the distance is placed on the Y-axis and time on the X-axis. Also, you can see three different curves, each represent the distance travelled by three different bodies. Let us consider that the black curve (line3) represents body A, the green one (line 1) represents body B and the violet (line 2) one represents body C.
Without any values just with the slope and curve, you will be able to find out the type of motion the body is experiencing, and this is exactly why we plot the distant time graph.
-The Green line (line 1) is a line straight and parallel to the X-axis, thus representing no motion on the body even as time changes. So, the body is at rest.
-While the violet line (line 2) is a straight line passing through the origin and making an angle of $45^\circ $ with both the axes. This represents uniform velocity of the body.
-The black line (line 3) is a curve and thus represents non-uniform velocity of the body.
You can also calculate the slope of the graph to find the accurate velocity of the body. Plot two points of the graph on the graph such that their coordinates are $({X_1},{Y_1})$ and $({X_2},{Y_2})$ .Now we could calculate the slope of the graph using $slope = \dfrac{{{Y_2} - {Y_1}}}{{{X_2} - {X_1}}}$ which gives us $\dfrac{d}{t}$ which is the speed of a body. Thus, calculating the slope of your distance-time graph you can find the velocity of the body and you can also find the distance the body travelled using the graph.
Note
The other motion graphs can also be used to find the area of the curve thus giving the differential of the motion parameter of that graph. For instance, the area of velocity time graph gives displacement which is $\dfrac{{dv}}{{dt}} = s$ where $v$ is the velocity and $s$ is the displacement.
Formulas used: We will be using the formula, $v = \dfrac{d}{t}$ where $v$ is speed, $d$ is the distance travelled by the body, and $t$ denotes time. Also Slope of a graph can be found by using $slope = \dfrac{{{Y_2} - {Y_1}}}{{{X_2} - {X_1}}}$ .
Complete Step by step answer
A motion graph is a two-dimensional graph between any 2 quantities that can define the motion of the object. Usually time is used as the basic and fixed component and is plotted on the X-axis. The Y-axis can have variable quantities like Distance, velocity, or acceleration.
When the Y-axis of a motion graph is plotted with distance then the graph is called distance graph. And this is how a distance-time graph looks like.
In the Above graph you can clearly see that the distance is placed on the Y-axis and time on the X-axis. Also, you can see three different curves, each represent the distance travelled by three different bodies. Let us consider that the black curve (line3) represents body A, the green one (line 1) represents body B and the violet (line 2) one represents body C.
Without any values just with the slope and curve, you will be able to find out the type of motion the body is experiencing, and this is exactly why we plot the distant time graph.
-The Green line (line 1) is a line straight and parallel to the X-axis, thus representing no motion on the body even as time changes. So, the body is at rest.
-While the violet line (line 2) is a straight line passing through the origin and making an angle of $45^\circ $ with both the axes. This represents uniform velocity of the body.
-The black line (line 3) is a curve and thus represents non-uniform velocity of the body.
You can also calculate the slope of the graph to find the accurate velocity of the body. Plot two points of the graph on the graph such that their coordinates are $({X_1},{Y_1})$ and $({X_2},{Y_2})$ .Now we could calculate the slope of the graph using $slope = \dfrac{{{Y_2} - {Y_1}}}{{{X_2} - {X_1}}}$ which gives us $\dfrac{d}{t}$ which is the speed of a body. Thus, calculating the slope of your distance-time graph you can find the velocity of the body and you can also find the distance the body travelled using the graph.
Note
The other motion graphs can also be used to find the area of the curve thus giving the differential of the motion parameter of that graph. For instance, the area of velocity time graph gives displacement which is $\dfrac{{dv}}{{dt}} = s$ where $v$ is the velocity and $s$ is the displacement.
Recently Updated Pages
Master Class 11 Computer Science: Engaging Questions & Answers for Success
Master Class 11 Business Studies: Engaging Questions & Answers for Success
Master Class 11 Economics: Engaging Questions & Answers for Success
Master Class 11 English: Engaging Questions & Answers for Success
Master Class 11 Maths: Engaging Questions & Answers for Success
Master Class 11 Biology: Engaging Questions & Answers for Success
Trending doubts
One Metric ton is equal to kg A 10000 B 1000 C 100 class 11 physics CBSE
There are 720 permutations of the digits 1 2 3 4 5 class 11 maths CBSE
Discuss the various forms of bacteria class 11 biology CBSE
Draw a diagram of a plant cell and label at least eight class 11 biology CBSE
State the laws of reflection of light
Explain zero factorial class 11 maths CBSE