


Distinguish between:
Simple Bar Diagram and Multiple Bar Diagram
Answer
528.4k+ views
Hint: As we know, Bar diagrams are used to give data a pictorial view to make it good to present it to someone. As we also know, a Bar diagram is a chart that represents data with different types of categories in the form of bars with height which shows the values of the different categories of data. It can be plotted vertically and horizontally according to one's need. Along with that, we also know, it is mostly used to compare different categories of any product or anything in different aspects.
Complete step-by-step answer:
As per the question,
We know that,
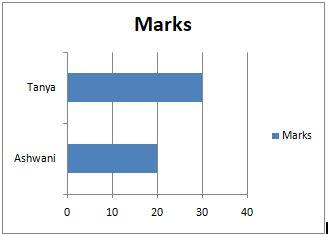
Simple Bar diagram is a type of Bar graph, chart or diagram which presents different categories of data as rectangular bars of various lengths. It is also known as pillar diagram as it has only one quality or quantity of different categories of data to compare with. Now, the table given below is holding a type of data to make this type of bar diagram.
Multiple bar diagrams are a type of Bar graph in which different categories of data are compared in different aspects. In this type of diagram, bars with different types of colors are used to show different aspects of a single category. It is mainly used to compare multiple data sets by making different bars side by side in a cluster. Now, the table given below is holding different data sets.
Note: Now, we know a very well about the simple bar diagram and multiple bar diagram but always remember to not get confused between the two when using them in a work, they both have their different uses and are always very helpful to present our work efficiently.
Complete step-by-step answer:
As per the question,
We know that,
Simple Bar diagram is a type of Bar graph, chart or diagram which presents different categories of data as rectangular bars of various lengths. It is also known as pillar diagram as it has only one quality or quantity of different categories of data to compare with. Now, the table given below is holding a type of data to make this type of bar diagram.
| Name | Marks |
| Ashwani | 20 |
| Tanya | 30 |
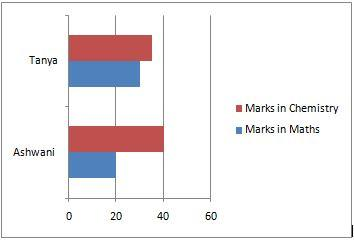
Multiple bar diagrams are a type of Bar graph in which different categories of data are compared in different aspects. In this type of diagram, bars with different types of colors are used to show different aspects of a single category. It is mainly used to compare multiple data sets by making different bars side by side in a cluster. Now, the table given below is holding different data sets.
| Name | Marks in Maths | Marks in Chemistry |
| Ashwani | 20 | 40 |
| Tanya | 30 | 35 |
Note: Now, we know a very well about the simple bar diagram and multiple bar diagram but always remember to not get confused between the two when using them in a work, they both have their different uses and are always very helpful to present our work efficiently.
Recently Updated Pages
Master Class 10 Computer Science: Engaging Questions & Answers for Success
Master Class 10 General Knowledge: Engaging Questions & Answers for Success
Master Class 10 English: Engaging Questions & Answers for Success
Master Class 10 Social Science: Engaging Questions & Answers for Success
Master Class 10 Maths: Engaging Questions & Answers for Success
Master Class 10 Science: Engaging Questions & Answers for Success
Trending doubts
What is the median of the first 10 natural numbers class 10 maths CBSE
Which women's tennis player has 24 Grand Slam singles titles?
Who is the Brand Ambassador of Incredible India?
Why is there a time difference of about 5 hours between class 10 social science CBSE
Write a letter to the principal requesting him to grant class 10 english CBSE
A moving boat is observed from the top of a 150 m high class 10 maths CBSE