


What does the area under distance time graph and velocity time graph represent?
Answer
569.7k+ views
Hint: Draw any type of curve in the distance time graph and calculate the area under that curve to determine the unit of area. The unit of area under the curve will give the physical quantity that the area under the curve represents.
Complete answer:
Let’s draw the distance time graph of the body from position \[{x_1}\]to \[{x_2}\] as shown in the figure below.
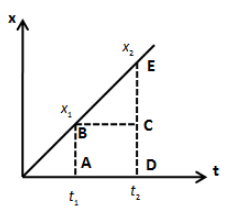
The area under the above curve is the sum of the area of rectangle ABCD and triangle BCE. Therefore, we can express the area under the curve as follows,
\[A = \left( {AB \times AD} \right) + \left( {\dfrac{1}{2} \times BC \times CE} \right)\]
\[ \Rightarrow A = \left( {{x_1}} \right)\left( {{t_2} - {t_1}} \right) + \left( {\dfrac{1}{2}\left( {{t_2} - {t_1}} \right)\left( {{x_2} - {x_1}} \right)} \right)\]
\[ \Rightarrow A = \left( {{t_2} - {t_1}} \right)\left( {{x_1} + \dfrac{1}{2}{x_2} - \dfrac{1}{2}{x_1}} \right)\]
\[ \Rightarrow A = \left( {{t_2} - {t_1}} \right)\left( {\dfrac{{{x_1} + {x_2}}}{2}} \right)\]
If we look at the unit of the term on the right hand side of the above equation, it gives,
\[A = {\text{meter}} \times \sec \]
Therefore, we can see it has no meaning. The area under distance time graph gives nothing.
Let’s draw the graph of velocity of the body with respect to time as follows,
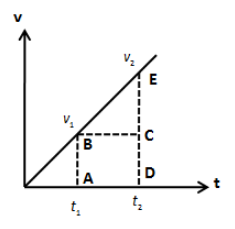
The area under the above curve is the sum of the area of rectangle ABCD and triangle BCE. Therefore, we can express the area under the curve as follows,
\[A = \left( {AB \times AD} \right) + \left( {\dfrac{1}{2} \times BC \times CE} \right)\]
\[ \Rightarrow A = \left( {{v_1}} \right)\left( {{t_2} - {t_1}} \right) + \left( {\dfrac{1}{2}\left( {{t_2} - {t_1}} \right)\left( {{v_2} - {v_1}} \right)} \right)\]
\[ \Rightarrow A = \left( {{t_2} - {t_1}} \right)\left( {{v_1} + \dfrac{1}{2}{v_2} - \dfrac{1}{2}{v_1}} \right)\]
\[ \Rightarrow A = \left( {{t_2} - {t_1}} \right)\left( {\dfrac{{{v_1} + {v_2}}}{2}} \right)\]
\[ \Rightarrow A = \dfrac{{\left( {{v_1} + {v_2}} \right)\left( {\Delta t} \right)}}{2}\]
If we look at the right hand side of the above equation and determine the unit, we get,
\[A = {\text{m/s}} \times {\text{s}}\]
\[ \therefore A = {\text{meter}}\]
Therefore, the area under the curve of the velocity time graph gives distance covered by the body.
Note: The gradient of the curve in the distance time graph defines the velocity of the body. Also, the gradient of the curve in the velocity time graph defines the acceleration of the body. The area under the curve can be calculated by integrating the curve. The derivative of the function mapped by the distance time curve is the velocity. You can recall the formula for average velocity to verify the above discussion.
Complete answer:
Let’s draw the distance time graph of the body from position \[{x_1}\]to \[{x_2}\] as shown in the figure below.
The area under the above curve is the sum of the area of rectangle ABCD and triangle BCE. Therefore, we can express the area under the curve as follows,
\[A = \left( {AB \times AD} \right) + \left( {\dfrac{1}{2} \times BC \times CE} \right)\]
\[ \Rightarrow A = \left( {{x_1}} \right)\left( {{t_2} - {t_1}} \right) + \left( {\dfrac{1}{2}\left( {{t_2} - {t_1}} \right)\left( {{x_2} - {x_1}} \right)} \right)\]
\[ \Rightarrow A = \left( {{t_2} - {t_1}} \right)\left( {{x_1} + \dfrac{1}{2}{x_2} - \dfrac{1}{2}{x_1}} \right)\]
\[ \Rightarrow A = \left( {{t_2} - {t_1}} \right)\left( {\dfrac{{{x_1} + {x_2}}}{2}} \right)\]
If we look at the unit of the term on the right hand side of the above equation, it gives,
\[A = {\text{meter}} \times \sec \]
Therefore, we can see it has no meaning. The area under distance time graph gives nothing.
Let’s draw the graph of velocity of the body with respect to time as follows,
The area under the above curve is the sum of the area of rectangle ABCD and triangle BCE. Therefore, we can express the area under the curve as follows,
\[A = \left( {AB \times AD} \right) + \left( {\dfrac{1}{2} \times BC \times CE} \right)\]
\[ \Rightarrow A = \left( {{v_1}} \right)\left( {{t_2} - {t_1}} \right) + \left( {\dfrac{1}{2}\left( {{t_2} - {t_1}} \right)\left( {{v_2} - {v_1}} \right)} \right)\]
\[ \Rightarrow A = \left( {{t_2} - {t_1}} \right)\left( {{v_1} + \dfrac{1}{2}{v_2} - \dfrac{1}{2}{v_1}} \right)\]
\[ \Rightarrow A = \left( {{t_2} - {t_1}} \right)\left( {\dfrac{{{v_1} + {v_2}}}{2}} \right)\]
\[ \Rightarrow A = \dfrac{{\left( {{v_1} + {v_2}} \right)\left( {\Delta t} \right)}}{2}\]
If we look at the right hand side of the above equation and determine the unit, we get,
\[A = {\text{m/s}} \times {\text{s}}\]
\[ \therefore A = {\text{meter}}\]
Therefore, the area under the curve of the velocity time graph gives distance covered by the body.
Note: The gradient of the curve in the distance time graph defines the velocity of the body. Also, the gradient of the curve in the velocity time graph defines the acceleration of the body. The area under the curve can be calculated by integrating the curve. The derivative of the function mapped by the distance time curve is the velocity. You can recall the formula for average velocity to verify the above discussion.
Recently Updated Pages
Master Class 11 Computer Science: Engaging Questions & Answers for Success
Master Class 11 Business Studies: Engaging Questions & Answers for Success
Master Class 11 Economics: Engaging Questions & Answers for Success
Master Class 11 English: Engaging Questions & Answers for Success
Master Class 11 Maths: Engaging Questions & Answers for Success
Master Class 11 Biology: Engaging Questions & Answers for Success
Trending doubts
One Metric ton is equal to kg A 10000 B 1000 C 100 class 11 physics CBSE
There are 720 permutations of the digits 1 2 3 4 5 class 11 maths CBSE
Discuss the various forms of bacteria class 11 biology CBSE
Draw a diagram of a plant cell and label at least eight class 11 biology CBSE
State the laws of reflection of light
Explain zero factorial class 11 maths CBSE