


Why does the most-probable speed correspond to the top of the Maxwell-Boltzmann distribution curve, even though the root-mean-square speed is the highest? Why are average and root-mean-square to the right?
Answer
487.5k+ views
Hint: The maxwell distribution curve is a plot of fraction of molecule and the velocity/speed of the molecule at a certain temperature. The area under the curve will give us the number of molecules for that particular speed. IF we heat the gas, the peak will be shifted to the right as the average speed will increase.
Complete answer:
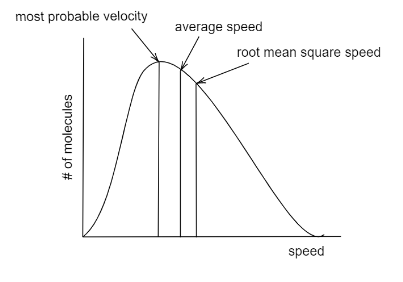
The Maxwell Boltzmann distribution law was first announced around 1850 by the physicist James Clerk Maxwell and was later modified and simplified by Ludwig Boltzmann who put a relation on a sounder basis. The distribution curve gives us a plot of velocities of molecules out of which the most probable velocity peaks the plot. The plot can be given as:

The most probable velocity is given as ${v_{mp}}$: It is the highest point on the plot meaning that only a small fraction of molecules have this speed, but it is more likely for molecules to have this speed than other velocities.
Average speed given as $ < v > $: This the average speed of all the particles, which is total speed divided by the no. of particles.
The mathematical representations for different velocities is given as: ${v_{mp}} = \sqrt {\dfrac{{2{k_B}T}}{m},} < v > = \sqrt {\dfrac{{8{k_B}T}}{{\pi m}}} ,{v_{rms}} = \sqrt {\dfrac{{3{k_B}T}}{m}} $
From taking out everything that is in common $\left( {\sqrt {\dfrac{{{k_B}T}}{m}} } \right)$ , we the values in the order: $\sqrt 3 > 2\sqrt {{{2} \!\mathord{\left/
{\vphantom {2 \pi }}\right.}
\!\lower0.7ex\hbox{$\pi $}}} > \sqrt 2 $
Hence the increasing order of velocity can be given as: ${v_{rms}} > {v_{avg}} > {v_{mp}}$
Hence, we can say that from left to right the molecular speed increases on the x-axis. The height of the peak on the y-axis doesn’t determine faster speed. Since M.P speed has the least velocity, and it occupies the highest point, we can say that more no. of molecules has the M.P velocity. The faster velocity is RMS Velocity, which only a very fraction of molecules depicts.
Note:
We have seen that being the highest point on the plot, doesn’t determine the highest value. The y-axis, which is the fraction of molecules, is highest for M.P velocity, which means that more molecules have this velocity. Remembering the mathematical representation of the velocity, will help us arrange them in increasing order.
Complete answer:
The Maxwell Boltzmann distribution law was first announced around 1850 by the physicist James Clerk Maxwell and was later modified and simplified by Ludwig Boltzmann who put a relation on a sounder basis. The distribution curve gives us a plot of velocities of molecules out of which the most probable velocity peaks the plot. The plot can be given as:
The most probable velocity is given as ${v_{mp}}$: It is the highest point on the plot meaning that only a small fraction of molecules have this speed, but it is more likely for molecules to have this speed than other velocities.
Average speed given as $ < v > $: This the average speed of all the particles, which is total speed divided by the no. of particles.
The mathematical representations for different velocities is given as: ${v_{mp}} = \sqrt {\dfrac{{2{k_B}T}}{m},} < v > = \sqrt {\dfrac{{8{k_B}T}}{{\pi m}}} ,{v_{rms}} = \sqrt {\dfrac{{3{k_B}T}}{m}} $
From taking out everything that is in common $\left( {\sqrt {\dfrac{{{k_B}T}}{m}} } \right)$ , we the values in the order: $\sqrt 3 > 2\sqrt {{{2} \!\mathord{\left/
{\vphantom {2 \pi }}\right.}
\!\lower0.7ex\hbox{$\pi $}}} > \sqrt 2 $
Hence the increasing order of velocity can be given as: ${v_{rms}} > {v_{avg}} > {v_{mp}}$
Hence, we can say that from left to right the molecular speed increases on the x-axis. The height of the peak on the y-axis doesn’t determine faster speed. Since M.P speed has the least velocity, and it occupies the highest point, we can say that more no. of molecules has the M.P velocity. The faster velocity is RMS Velocity, which only a very fraction of molecules depicts.
Note:
We have seen that being the highest point on the plot, doesn’t determine the highest value. The y-axis, which is the fraction of molecules, is highest for M.P velocity, which means that more molecules have this velocity. Remembering the mathematical representation of the velocity, will help us arrange them in increasing order.
Recently Updated Pages
Master Class 11 Computer Science: Engaging Questions & Answers for Success
Master Class 11 Business Studies: Engaging Questions & Answers for Success
Master Class 11 Economics: Engaging Questions & Answers for Success
Master Class 11 English: Engaging Questions & Answers for Success
Master Class 11 Maths: Engaging Questions & Answers for Success
Master Class 11 Biology: Engaging Questions & Answers for Success
Trending doubts
One Metric ton is equal to kg A 10000 B 1000 C 100 class 11 physics CBSE
There are 720 permutations of the digits 1 2 3 4 5 class 11 maths CBSE
Discuss the various forms of bacteria class 11 biology CBSE
Draw a diagram of a plant cell and label at least eight class 11 biology CBSE
State the laws of reflection of light
Explain zero factorial class 11 maths CBSE