


How does the period of an oscillation in a spring-mass system depend on mass and amplitude? How can I express this graphically for period as a function of mass, period as a function of the square root of the mass, and period as a function of amplitude?
Answer
524.4k+ views
Hint: In order to answer the following question, we will be describing the most basic spring-mass system. We will derive the equation of the time period of oscillations of such a system. Finally, we will represent the graph of time period with different types of variables as asked in the question.
Formula used:
Time period of oscillation: $T=2\pi \sqrt{\dfrac{m}{k}}$
Where $m$ is the mass and $k$ is the spring constant.
Complete step by step answer:
First of all, we will draw a simple diagram of a spring-mass system.
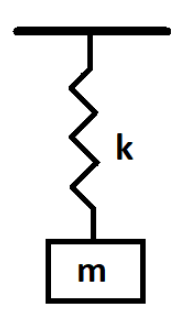
As we can see from the figure, a mass$(m)$ is suspended with the help of a spring having a spring constant of ($k$). If the spring is stretched and then released, the spring-mass system will oscillate. The formulae for time period for such oscillation is given by
$T=2\pi \sqrt{\dfrac{m}{k}}$
If we square both sides of the above equation, the equation becomes
$\therefore {{T}^{2}}=4{{\pi }^{2}}\dfrac{m}{k}$
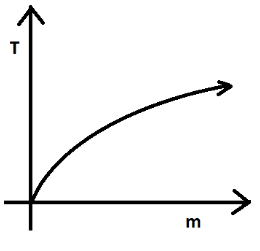
The above equation implies that the time period of oscillation is directly proportional to the square root of mass. It also states that the time period is independent of the amplitude.Therefore, if we plot a graph of $T$ vs $m$ , we will have a square root graph
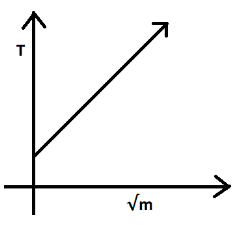
Now, if we plot a graph of $T$ vs $\sqrt{m}$, then we get a linear graph with a gradient equal to $\dfrac{2\pi }{\sqrt{k}}$
Lastly, the graph of $T$ vs $A$ (amplitude) will represent a horizontal line as time period is independent of amplitude.
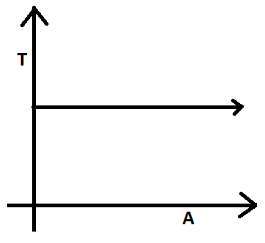
Note:It is very important to keep in mind that the graph of $T$ vs $A$ will give you a horizontal line because time period is independent of amplitude and will remain constant with change in amplitude. Now, if the spring is overstretched or if it jumps, then this dependence may vary and the graph will not be a horizontal line.
Formula used:
Time period of oscillation: $T=2\pi \sqrt{\dfrac{m}{k}}$
Where $m$ is the mass and $k$ is the spring constant.
Complete step by step answer:
First of all, we will draw a simple diagram of a spring-mass system.
As we can see from the figure, a mass$(m)$ is suspended with the help of a spring having a spring constant of ($k$). If the spring is stretched and then released, the spring-mass system will oscillate. The formulae for time period for such oscillation is given by
$T=2\pi \sqrt{\dfrac{m}{k}}$
If we square both sides of the above equation, the equation becomes
$\therefore {{T}^{2}}=4{{\pi }^{2}}\dfrac{m}{k}$
The above equation implies that the time period of oscillation is directly proportional to the square root of mass. It also states that the time period is independent of the amplitude.Therefore, if we plot a graph of $T$ vs $m$ , we will have a square root graph
Now, if we plot a graph of $T$ vs $\sqrt{m}$, then we get a linear graph with a gradient equal to $\dfrac{2\pi }{\sqrt{k}}$
Lastly, the graph of $T$ vs $A$ (amplitude) will represent a horizontal line as time period is independent of amplitude.
Note:It is very important to keep in mind that the graph of $T$ vs $A$ will give you a horizontal line because time period is independent of amplitude and will remain constant with change in amplitude. Now, if the spring is overstretched or if it jumps, then this dependence may vary and the graph will not be a horizontal line.
Recently Updated Pages
Master Class 11 Computer Science: Engaging Questions & Answers for Success
Master Class 11 Business Studies: Engaging Questions & Answers for Success
Master Class 11 Economics: Engaging Questions & Answers for Success
Master Class 11 English: Engaging Questions & Answers for Success
Master Class 11 Maths: Engaging Questions & Answers for Success
Master Class 11 Biology: Engaging Questions & Answers for Success
Trending doubts
One Metric ton is equal to kg A 10000 B 1000 C 100 class 11 physics CBSE
There are 720 permutations of the digits 1 2 3 4 5 class 11 maths CBSE
Discuss the various forms of bacteria class 11 biology CBSE
Draw a diagram of a plant cell and label at least eight class 11 biology CBSE
State the laws of reflection of light
10 examples of friction in our daily life