


What does the slope of the position-time graph indicate?
Answer
499.5k+ views
Hint: Let us first get some idea about graphs. A graph is a structure consisting of a set of items in which some pairs of the objects are in some way "connected" in mathematics, and more specifically in graph theory. Each of the connected pairs of vertices is termed an edge, and the objects correspond to mathematical abstractions called vertices (sometimes called nodes or points) (also called link or line). A graph is typically portrayed as a group of dots or circles for the vertices, linked by lines or curves for the edges, in diagrammatic form.
Complete step by step solution:
The velocity of an object is represented by the slope of a location graph. As a result, the value of the slope at a given moment shows the object's velocity at that time.
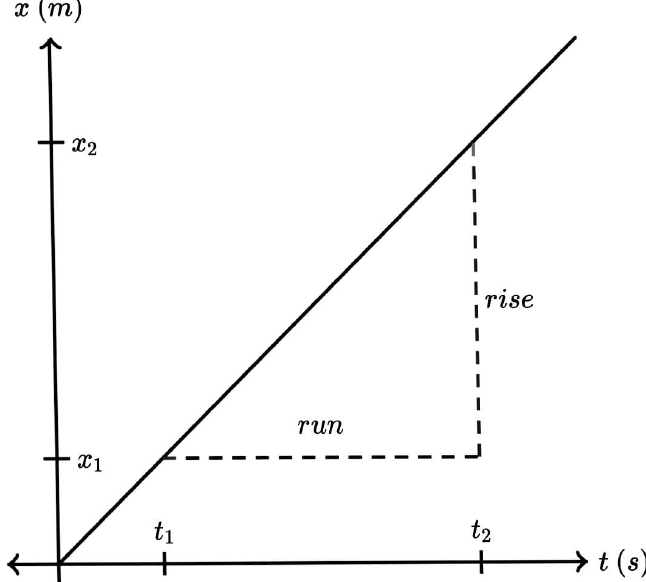
So, we can write from the above graph:
The slope of this position graph is: $Slope = \dfrac{{rise}}{{run}} = \dfrac{{{x_2} - {x_1}}}{{{t_2} - {t_1}}}$
The concept of velocity is the same as the definition of slope:
$v = \dfrac{{\vartriangle x}}{{\vartriangle t}} = \dfrac{{{x_2} - {x_1}}}{{{t_2} - {t_1}}}$. The slope of the position graph has to equal the velocity.
Another thing to remember is that the instantaneous velocity is determined by the slope of a position graph at a given point in time.
Note: You may get the average velocity between two places in time by calculating the average slope between them. The average velocity does not have to match the immediate velocity. If, on the other hand, the slope remains constant over time (i.e., the graph is a straight line segment), the instantaneous velocity equals the average velocity between any two places on the line segment.
Complete step by step solution:
The velocity of an object is represented by the slope of a location graph. As a result, the value of the slope at a given moment shows the object's velocity at that time.
So, we can write from the above graph:
The slope of this position graph is: $Slope = \dfrac{{rise}}{{run}} = \dfrac{{{x_2} - {x_1}}}{{{t_2} - {t_1}}}$
The concept of velocity is the same as the definition of slope:
$v = \dfrac{{\vartriangle x}}{{\vartriangle t}} = \dfrac{{{x_2} - {x_1}}}{{{t_2} - {t_1}}}$. The slope of the position graph has to equal the velocity.
Another thing to remember is that the instantaneous velocity is determined by the slope of a position graph at a given point in time.
Note: You may get the average velocity between two places in time by calculating the average slope between them. The average velocity does not have to match the immediate velocity. If, on the other hand, the slope remains constant over time (i.e., the graph is a straight line segment), the instantaneous velocity equals the average velocity between any two places on the line segment.
Recently Updated Pages
Master Class 11 Computer Science: Engaging Questions & Answers for Success
Master Class 11 Business Studies: Engaging Questions & Answers for Success
Master Class 11 Economics: Engaging Questions & Answers for Success
Master Class 11 English: Engaging Questions & Answers for Success
Master Class 11 Maths: Engaging Questions & Answers for Success
Master Class 11 Biology: Engaging Questions & Answers for Success
Trending doubts
One Metric ton is equal to kg A 10000 B 1000 C 100 class 11 physics CBSE
There are 720 permutations of the digits 1 2 3 4 5 class 11 maths CBSE
Discuss the various forms of bacteria class 11 biology CBSE
Draw a diagram of a plant cell and label at least eight class 11 biology CBSE
State the laws of reflection of light
Explain zero factorial class 11 maths CBSE