


How do you draw a box and whisker plot of the data: $29$, $33$, $36$, $37$, $39$, $40$, $41$?
Answer
552.3k+ views
Hint: In this problem we have asked to draw the box and whisker plot of the given data. For this plot we need to have the data in ascending order and the values of minimum, maximum, median, first quartile, third quartile. So, we will check whether the given data is in ascending order or not, if not then we will arrange the data in ascending order. Luckily the given data is in ascending order. Now we will take the maximum and minimum values of the data and the number of observations we have in the given data. Now we will calculate the median of the given data which is ${{\left( \dfrac{n+1}{2} \right)}^{th}}$ for odd number of observations and mean of ${{\left( \dfrac{n}{2} \right)}^{th}}$ observation and ${{\left( \dfrac{n}{2}+1 \right)}^{th}}$ term for even number of observations. For the first and third quartile we will find the medians of lower half data and upper half data. After having all the values, we will plot the box and whisker plot.
Complete step by step solution:
Given data, $29$, $33$, $36$, $37$, $39$, $40$, $41$.
We can observe that the above given data is in ascending order. So no more arrangements are needed. By observing the above data we can write
Maximum value in the given data is $41$.
Minimum value in the given data is $29$.
Number of observations in the given data is $7$ which is an odd number.
Now the median of the given data will be
$\begin{align}
& M={{\left( \dfrac{n+1}{2} \right)}^{th}}\text{ term} \\
& \Rightarrow M={{\left( \dfrac{7+1}{2} \right)}^{th}}\text{ term} \\
& \Rightarrow M={{4}^{th}}\text{ term} \\
\end{align}$
Fourth term in the given data is $37$.
Hence the Median of the given data is $37$.
Up to now we have the values of Maximum, Minimum, Median. To draw the plot we also need the values of the First quartile, Third quartile. For this we are assuming that the data which is before the Median value is lower half of the data and the data which is after the Median value is upper half of the data.
For calculating the First quartile we are considering the lower half of the data which is $29$, $33$, $36$. We have three observations in the lower half of the data.
Hence the Median of the lower half of the data is
$\begin{align}
& M={{\left( \dfrac{3+1}{2} \right)}^{th}}\text{ term} \\
& \Rightarrow M={{2}^{nd}}\text{ term} \\
\end{align}$
The second term in the lower half of the data is $33$.
Hence the First quartile which is nothing but the Median of the lower half of the data is $33$.
For calculating the Third quartile we are considering the upper half of the data which is $39$, $40$, $41$. Here also we have three observations, so the median will be the second term which is $40$.
Hence the Third quartile is $40$.
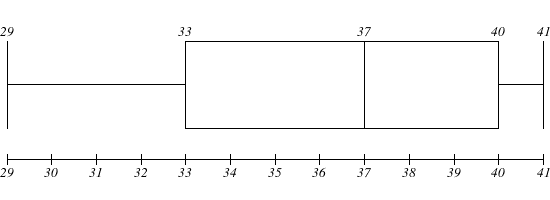
Now drawing the box and whisker plot by using the below values
Minimum Value: $29$
Maximum Value: $41$
Median Value: $37$
First Quartile: $33$
Third Quartile: $40$
Note:
In this problem they have asked to draw the box and whisker plot. Some students think that they are two different plots and get confused in examinations. But the box and whisker plot is a single plot.
Complete step by step solution:
Given data, $29$, $33$, $36$, $37$, $39$, $40$, $41$.
We can observe that the above given data is in ascending order. So no more arrangements are needed. By observing the above data we can write
Maximum value in the given data is $41$.
Minimum value in the given data is $29$.
Number of observations in the given data is $7$ which is an odd number.
Now the median of the given data will be
$\begin{align}
& M={{\left( \dfrac{n+1}{2} \right)}^{th}}\text{ term} \\
& \Rightarrow M={{\left( \dfrac{7+1}{2} \right)}^{th}}\text{ term} \\
& \Rightarrow M={{4}^{th}}\text{ term} \\
\end{align}$
Fourth term in the given data is $37$.
Hence the Median of the given data is $37$.
Up to now we have the values of Maximum, Minimum, Median. To draw the plot we also need the values of the First quartile, Third quartile. For this we are assuming that the data which is before the Median value is lower half of the data and the data which is after the Median value is upper half of the data.
For calculating the First quartile we are considering the lower half of the data which is $29$, $33$, $36$. We have three observations in the lower half of the data.
Hence the Median of the lower half of the data is
$\begin{align}
& M={{\left( \dfrac{3+1}{2} \right)}^{th}}\text{ term} \\
& \Rightarrow M={{2}^{nd}}\text{ term} \\
\end{align}$
The second term in the lower half of the data is $33$.
Hence the First quartile which is nothing but the Median of the lower half of the data is $33$.
For calculating the Third quartile we are considering the upper half of the data which is $39$, $40$, $41$. Here also we have three observations, so the median will be the second term which is $40$.
Hence the Third quartile is $40$.
Now drawing the box and whisker plot by using the below values
Minimum Value: $29$
Maximum Value: $41$
Median Value: $37$
First Quartile: $33$
Third Quartile: $40$
Note:
In this problem they have asked to draw the box and whisker plot. Some students think that they are two different plots and get confused in examinations. But the box and whisker plot is a single plot.
Recently Updated Pages
Master Class 10 Computer Science: Engaging Questions & Answers for Success
Master Class 10 General Knowledge: Engaging Questions & Answers for Success
Master Class 10 English: Engaging Questions & Answers for Success
Master Class 10 Social Science: Engaging Questions & Answers for Success
Master Class 10 Maths: Engaging Questions & Answers for Success
Master Class 10 Science: Engaging Questions & Answers for Success
Trending doubts
What is the median of the first 10 natural numbers class 10 maths CBSE
Which women's tennis player has 24 Grand Slam singles titles?
Who is the Brand Ambassador of Incredible India?
Why is there a time difference of about 5 hours between class 10 social science CBSE
Write a letter to the principal requesting him to grant class 10 english CBSE
State and prove converse of BPT Basic Proportionality class 10 maths CBSE