


Draw a “less than type” given and “more than type” given for the following distribution and hence obtain the median from the graph.
C.I. 20-30 30-40 40-50 50-60 60-70 70-80 80-90 Frequency 8 12 24 6 10 15 25
| C.I. | 20-30 | 30-40 | 40-50 | 50-60 | 60-70 | 70-80 | 80-90 |
| Frequency | 8 | 12 | 24 | 6 | 10 | 15 | 25 |
Answer
564.6k+ views
Hint:
Here, we will use the concept of the less than and more than type ogive to find out the respective curve. First, we will create a table of the less than type ogive then we will plot it on the graph. Then we will create another table for the more than type ogive and then we will plot this more than type ogive on the graph.
Complete step by step solution:
Here we will create the table for the “less than type” given. Therefore, we get
Now we will plot this “less than type” ogive on the graph from the table of the less than type ogive, we get
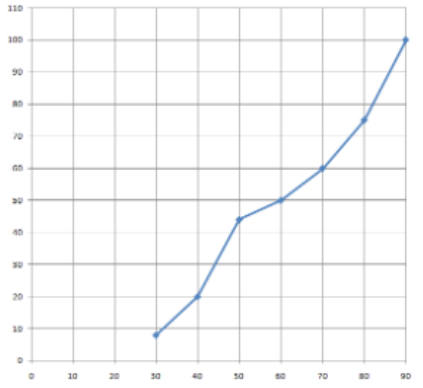
Here, the blue line represents “less than type”.
Now we will find the table for the “more than type” ogive. Therefore, we get
Now we will plot this “more than type” given on the same graph.
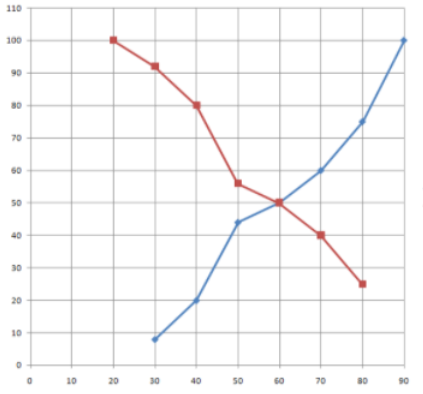
Here the blue line represents “less than type” and the red line represents “more than type”.
Hence, we have plotted the Less than type and more than type ogive curve on the graph.
Now we will find the median of the data. We know that the middlemost term of the data is known as the median. So, in this case, where curve 1 and curve 2 intersects is the middle part of the data. So by projecting the line on the X-axis from that point we can see the value of the median. We can see that the line projected from the point of intersection of the curve on the X-axis cut it at point 60.
So, the value of the median is 60.
Note:
We know that in the less than type ogive, the cumulative frequency always increases, and in the case of more than type ogive, the cumulative frequency always decreases.
Here we have to find the cumulative frequencies to calculate the table of the less than type and more than type. Cumulative frequency is obtained by adding the preceding frequency of the class interval. We should also know that the Median is the middlemost value of the given data and the mean is the average of the data given.
Here, we will use the concept of the less than and more than type ogive to find out the respective curve. First, we will create a table of the less than type ogive then we will plot it on the graph. Then we will create another table for the more than type ogive and then we will plot this more than type ogive on the graph.
Complete step by step solution:
Here we will create the table for the “less than type” given. Therefore, we get
| Less than | Cumulative frequency |
| Less than 30 | 8 |
| Less than 40 | 20 |
| Less than 50 | 44 |
| Less than 60 | 50 |
| Less than 70 | 60 |
| Less than 80 | 75 |
| Less than 90 | 100 |
Now we will plot this “less than type” ogive on the graph from the table of the less than type ogive, we get
Here, the blue line represents “less than type”.
Now we will find the table for the “more than type” ogive. Therefore, we get
| More than | Cumulative frequency |
| More than 80 | 25 |
| More than 70 | 40 |
| More than 60 | 50 |
| More than 50 | 56 |
| More than 40 | 80 |
| More than 30 | 92 |
| More than 20 | 100 |
Now we will plot this “more than type” given on the same graph.
Here the blue line represents “less than type” and the red line represents “more than type”.
Hence, we have plotted the Less than type and more than type ogive curve on the graph.
Now we will find the median of the data. We know that the middlemost term of the data is known as the median. So, in this case, where curve 1 and curve 2 intersects is the middle part of the data. So by projecting the line on the X-axis from that point we can see the value of the median. We can see that the line projected from the point of intersection of the curve on the X-axis cut it at point 60.
So, the value of the median is 60.
Note:
We know that in the less than type ogive, the cumulative frequency always increases, and in the case of more than type ogive, the cumulative frequency always decreases.
Here we have to find the cumulative frequencies to calculate the table of the less than type and more than type. Cumulative frequency is obtained by adding the preceding frequency of the class interval. We should also know that the Median is the middlemost value of the given data and the mean is the average of the data given.
Recently Updated Pages
Master Class 11 Computer Science: Engaging Questions & Answers for Success
Master Class 11 Business Studies: Engaging Questions & Answers for Success
Master Class 11 Economics: Engaging Questions & Answers for Success
Master Class 11 English: Engaging Questions & Answers for Success
Master Class 11 Maths: Engaging Questions & Answers for Success
Master Class 11 Biology: Engaging Questions & Answers for Success
Trending doubts
One Metric ton is equal to kg A 10000 B 1000 C 100 class 11 physics CBSE
There are 720 permutations of the digits 1 2 3 4 5 class 11 maths CBSE
Discuss the various forms of bacteria class 11 biology CBSE
Draw a diagram of a plant cell and label at least eight class 11 biology CBSE
State the laws of reflection of light
10 examples of friction in our daily life