


Draw a percentage bar graph for the following data:
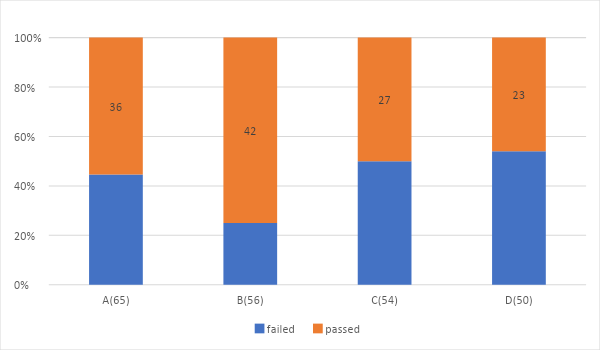
Divisions A B C D Total strength 65 56 54 50 students passed in English 36 42 27 23
| Divisions | A | B | C | D |
| Total strength | 65 | 56 | 54 | 50 |
| students passed in English | 36 | 42 | 27 | 23 |
Answer
581.7k+ views
Hint: We first determine the formula to find the percentage of students passed in English. We take given data as two variables and find the percentages. Then we place them in a percentage bar graph to find out the illustration.
Complete step by step answer:
We find the percentage formula for the students who passed in English.
We are taking two variables x and y. x being the number of students passed in English in a single division and y being the total strength in that same division.
So, there are four divisions named A, B, C, D.
We find the percentage theorem as $\dfrac{{{x}_{i}}}{{{y}_{i}}}\times 100$ where $i=A,B,C,D$.
For division A the percentage is $\dfrac{36}{65}\times 100=55.38$.
For division B the percentage is $\dfrac{42}{56}\times 100=75$.
For division C the percentage is $\dfrac{27}{54}\times 100=50$.
For division D the percentage is $\dfrac{23}{50}\times 100=46$.
Now we make a table to illustrate this
We place the data to find the percentage bar
Note:
Percentage bar graph is used to find the comparison. The data of a single variable should be put under a single bar. We can also relate it with the numbers of students failing the English examination.
Complete step by step answer:
We find the percentage formula for the students who passed in English.
We are taking two variables x and y. x being the number of students passed in English in a single division and y being the total strength in that same division.
So, there are four divisions named A, B, C, D.
We find the percentage theorem as $\dfrac{{{x}_{i}}}{{{y}_{i}}}\times 100$ where $i=A,B,C,D$.
For division A the percentage is $\dfrac{36}{65}\times 100=55.38$.
For division B the percentage is $\dfrac{42}{56}\times 100=75$.
For division C the percentage is $\dfrac{27}{54}\times 100=50$.
For division D the percentage is $\dfrac{23}{50}\times 100=46$.
Now we make a table to illustrate this
| Divisions | total strength(y) | students passed in English(x) | percentages (%) |
| A | 65 | 36 | 55.38 |
| B | 56 | 42 | 75 |
| C | 54 | 27 | 50 |
| D | 50 | 23 | 46 |
We place the data to find the percentage bar
Note:
Percentage bar graph is used to find the comparison. The data of a single variable should be put under a single bar. We can also relate it with the numbers of students failing the English examination.
Recently Updated Pages
Master Class 11 Computer Science: Engaging Questions & Answers for Success
Master Class 11 Business Studies: Engaging Questions & Answers for Success
Master Class 11 Economics: Engaging Questions & Answers for Success
Master Class 11 English: Engaging Questions & Answers for Success
Master Class 11 Maths: Engaging Questions & Answers for Success
Master Class 11 Biology: Engaging Questions & Answers for Success
Trending doubts
One Metric ton is equal to kg A 10000 B 1000 C 100 class 11 physics CBSE
There are 720 permutations of the digits 1 2 3 4 5 class 11 maths CBSE
Discuss the various forms of bacteria class 11 biology CBSE
Draw a diagram of a plant cell and label at least eight class 11 biology CBSE
State the laws of reflection of light
Explain zero factorial class 11 maths CBSE