


How can I draw a velocity vector diagram?
Answer
555k+ views
Hint: Velocity diagrams are the diagrams that use a vector arrow to indicate the direction and the relative magnitude of a vector quantity. To define the velocity of a moving object during the phase, vector diagrams may be used. For instance to depict the motion of a car going down the road, a vector diagram may be used.
Complete answer:
The magnitude of a vector quantity is expressed by the scale of the vector arrow in a vector diagram if the arrow size is the same in each consecutive frame of the vector diagram, then the vector magnitude is constant. The diagram below shows a car's speeds during its motion. The scale of the velocity vector is constant in the top diagram so the diagram represents a motion of the constant velocity. The velocity vector size is increasing in the bottom diagram as we see one example.
Let's understand the velocity diagram with the example.
Assume that a bus is travelling at the velocity of the 70km/h.
After that bus turns in east and continues at the reduce speed of 50km/h
Now let’s check what resultant velocity is,
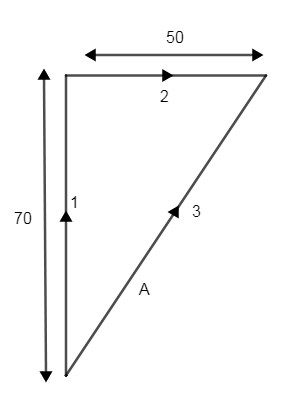
As we can see from the figure the first vector shown as line 1 which has speed of 70km/h and the second vector is shown as line 2 and ‘A’ vector is a resultant vector of the both speed of the line 1 and 2
This is how we can draw vector diagrams.
Note:
As an approach to solve this question first we have seen a definition of the velocity diagram which states that the velocity diagram can be used to describe the velocity of a moving object during its motion as we have seen by an example of the bus.
Complete answer:
The magnitude of a vector quantity is expressed by the scale of the vector arrow in a vector diagram if the arrow size is the same in each consecutive frame of the vector diagram, then the vector magnitude is constant. The diagram below shows a car's speeds during its motion. The scale of the velocity vector is constant in the top diagram so the diagram represents a motion of the constant velocity. The velocity vector size is increasing in the bottom diagram as we see one example.
Let's understand the velocity diagram with the example.
Assume that a bus is travelling at the velocity of the 70km/h.
After that bus turns in east and continues at the reduce speed of 50km/h
Now let’s check what resultant velocity is,
As we can see from the figure the first vector shown as line 1 which has speed of 70km/h and the second vector is shown as line 2 and ‘A’ vector is a resultant vector of the both speed of the line 1 and 2
This is how we can draw vector diagrams.
Note:
As an approach to solve this question first we have seen a definition of the velocity diagram which states that the velocity diagram can be used to describe the velocity of a moving object during its motion as we have seen by an example of the bus.
Recently Updated Pages
Master Class 11 Computer Science: Engaging Questions & Answers for Success
Master Class 11 Business Studies: Engaging Questions & Answers for Success
Master Class 11 Economics: Engaging Questions & Answers for Success
Master Class 11 English: Engaging Questions & Answers for Success
Master Class 11 Maths: Engaging Questions & Answers for Success
Master Class 11 Biology: Engaging Questions & Answers for Success
Trending doubts
One Metric ton is equal to kg A 10000 B 1000 C 100 class 11 physics CBSE
There are 720 permutations of the digits 1 2 3 4 5 class 11 maths CBSE
Discuss the various forms of bacteria class 11 biology CBSE
Draw a diagram of a plant cell and label at least eight class 11 biology CBSE
State the laws of reflection of light
Explain zero factorial class 11 maths CBSE