


Draw less than ogive for the following data.
Marks Frequency Cumulative Frequency 0-10 2 2 10-20 8 10 20-30 12 22 30-40 18 40 40-50 28 68 50-60 22 90 60-70 6 96 70-80 4 100
| Marks | Frequency | Cumulative Frequency |
| 0-10 | 2 | 2 |
| 10-20 | 8 | 10 |
| 20-30 | 12 | 22 |
| 30-40 | 18 | 40 |
| 40-50 | 28 | 68 |
| 50-60 | 22 | 90 |
| 60-70 | 6 | 96 |
| 70-80 | 4 | 100 |
Answer
581.4k+ views
Hint: To draw less than ogive for the given data, we have drawn X and Y axes. We will take cumulative frequencies along the y-axis and the upper-class limits on the x-axis. Now, we should plot cumulative frequencies against each upper class. We have drawn a continuous curve by connecting these points.
Complete step-by-step answer:
We have to draw less than ogive for the given data. Let us see what an ogive is.
Ogive displays the frequency distribution graph of a series. It is a graph of a cumulative distribution, which explains data values on the horizontal plane axis and either the cumulative relative frequencies, the cumulative frequencies or cumulative percent frequencies on the vertical axis.
Ogive graphs are frequency graphs that are used to exhibit the characteristics of discrete and continuous data. There are two types of ogive –Less than and More than.
Here, we have to plot less than ogive. Let us see the steps to do this.
Step1: We have to draw X and Y axes.
Step2: We will take cumulative frequencies along the y-axis and the upper-class limits on the x-axis.
Step3: Now, we should plot cumulative frequencies against each upper class.
Step4: We have to draw a continuous curve by connecting these points.
We have the data:
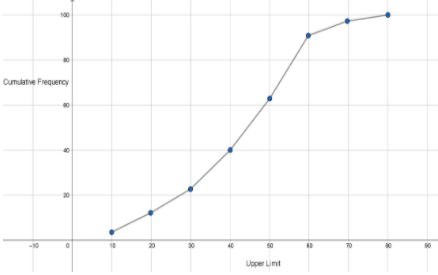
The less than ogive curve will be as follows:
Note: We should plot the upper class limits not the lower class limits. If we plot lower class limits it would be a greater than or more than ogive. We should plot cumulative frequency not frequency. Do not plot cumulative frequency on X-axis and upper limit on Y-axis.
Complete step-by-step answer:
We have to draw less than ogive for the given data. Let us see what an ogive is.
Ogive displays the frequency distribution graph of a series. It is a graph of a cumulative distribution, which explains data values on the horizontal plane axis and either the cumulative relative frequencies, the cumulative frequencies or cumulative percent frequencies on the vertical axis.
Ogive graphs are frequency graphs that are used to exhibit the characteristics of discrete and continuous data. There are two types of ogive –Less than and More than.
Here, we have to plot less than ogive. Let us see the steps to do this.
Step1: We have to draw X and Y axes.
Step2: We will take cumulative frequencies along the y-axis and the upper-class limits on the x-axis.
Step3: Now, we should plot cumulative frequencies against each upper class.
Step4: We have to draw a continuous curve by connecting these points.
We have the data:
| Marks | Frequency | Cumulative Frequency |
| 0-10 | 2 | 2 |
| 10-20 | 8 | 10 |
| 20-30 | 12 | 22 |
| 30-40 | 18 | 40 |
| 40-50 | 28 | 68 |
| 50-60 | 22 | 90 |
| 60-70 | 6 | 96 |
| 70-80 | 4 | 100 |
The less than ogive curve will be as follows:
Note: We should plot the upper class limits not the lower class limits. If we plot lower class limits it would be a greater than or more than ogive. We should plot cumulative frequency not frequency. Do not plot cumulative frequency on X-axis and upper limit on Y-axis.
Recently Updated Pages
Master Class 11 Computer Science: Engaging Questions & Answers for Success
Master Class 11 Business Studies: Engaging Questions & Answers for Success
Master Class 11 Economics: Engaging Questions & Answers for Success
Master Class 11 English: Engaging Questions & Answers for Success
Master Class 11 Maths: Engaging Questions & Answers for Success
Master Class 11 Biology: Engaging Questions & Answers for Success
Trending doubts
One Metric ton is equal to kg A 10000 B 1000 C 100 class 11 physics CBSE
There are 720 permutations of the digits 1 2 3 4 5 class 11 maths CBSE
Discuss the various forms of bacteria class 11 biology CBSE
Draw a diagram of a plant cell and label at least eight class 11 biology CBSE
State the laws of reflection of light
Explain zero factorial class 11 maths CBSE