


Draw the graph of $\log x$ .
Answer
574.2k+ views
Hint: For answering this question we need to draw a graph for the function $\log x$ . For that we will plot a curve for the respective values of $x$ and explore the basic definition of $\log x$ . The basic definition of $\log x$ says that for ${{a}^{y}}=x$ the logarithm value is given as $y={{\log }_{a}}x$ .
Complete step-by-step answer:
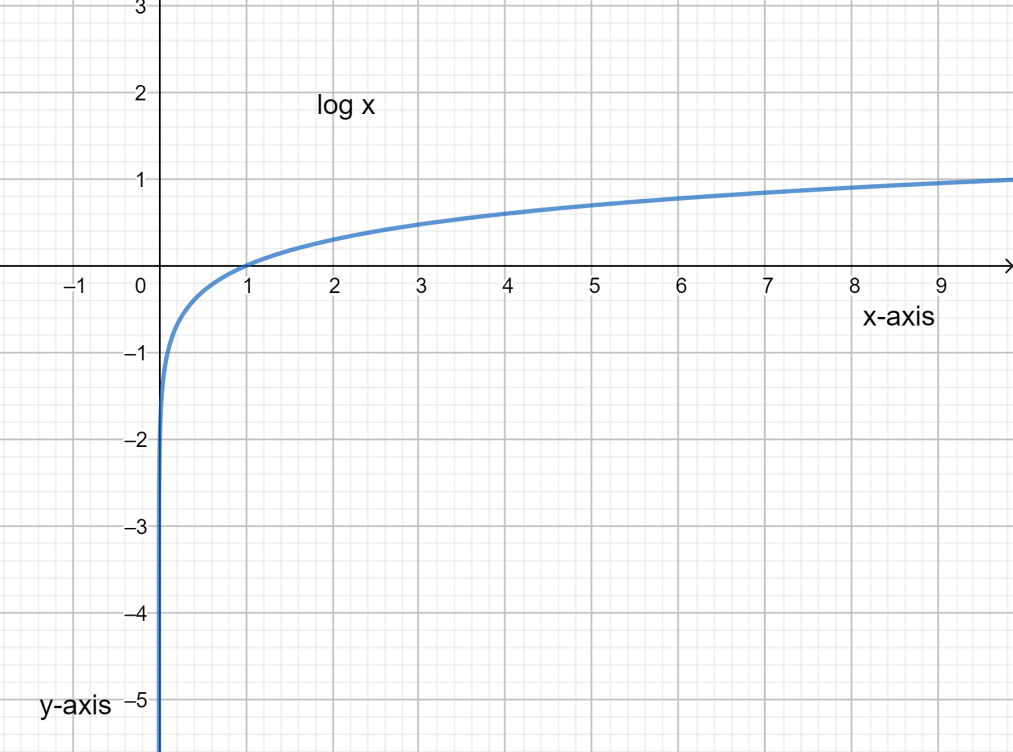
Now considering from the question we need to draw the graph for the function of $\log x$ .
From the basic definition of logarithm of a value for a function ${{a}^{y}}=x$ is given as $y={{\log }_{a}}x$ for $a > 0,a\ne 1$ . Here $x > 0$ is the domain for this function.
The graph will be continuous and smooth.
The curve is increasing for $a > 1$ and decreasing for $0 < a < 1$ .
The curve of $\log x$ intersects the x-axis when $x=1$ .
The logarithm function is of one-one type.
The logarithm function is the inverse of the exponential function.
Properties:
(i) ${{\log }_{a}}1=0$ because ${{a}^{0}}=1$ .
(ii) ${{\log }_{a}}~a\text{ }=\text{ }1$ because ${{a}^{1}}=a$ .
(iii) ${{\log }_{a}}{{a}^{x}}=x$ .
(iv) ${{\log }_{a}}x={{\log }_{a}}y\Rightarrow x=y$ .
(v) ${{\log }_{a}}x={{\log }_{b}}x\Rightarrow a=b$ .
Common logarithm has base 10 represented by $\log x$ .
Natural logarithm has a base $e$ represented by $\ln x$ .
Here we need to draw a graph of common logarithms.
Note: For answering questions based on logarithm functions we use different formulae like
$\log \left( ab \right)=\log a+\log b$, $\log \left( \dfrac{a}{b} \right)=\log a-\log b$ and many more. The logarithm properties give that $\ln e=1$ and $\log 10=1$ . There is also one special property given as ${{\log }_{a}}b=\dfrac{\log b}{\log a}$ and ${{\log }_{a}}b=\dfrac{1}{{{\log }_{b}}a}$ . As this is an inverse function we can say that ${{\log }_{a}}\left( {{x}^{n}} \right)=n{{\log }_{a}}x$ and ${{\log }_{a}}\left( \sqrt[n]{x} \right)=\dfrac{1}{n}{{\log }_{a}}x$ . We can say ${{a}^{{{\log }_{a}}x}}=x$ and ${{\log }_{a}}0=\left\{ \begin{matrix}
-\infty \text{ when a > 1} \\
\infty \text{ when a < 1} \\
\end{matrix} \right\}$ . We have another formulae saying that ${{\log }_{{{a}^{m}}}}{{a}^{n}}=\dfrac{n}{m}$ for $m\ne 0$ .
Complete step-by-step answer:
Now considering from the question we need to draw the graph for the function of $\log x$ .
From the basic definition of logarithm of a value for a function ${{a}^{y}}=x$ is given as $y={{\log }_{a}}x$ for $a > 0,a\ne 1$ . Here $x > 0$ is the domain for this function.
The graph will be continuous and smooth.
The curve is increasing for $a > 1$ and decreasing for $0 < a < 1$ .
The curve of $\log x$ intersects the x-axis when $x=1$ .
The logarithm function is of one-one type.
The logarithm function is the inverse of the exponential function.
Properties:
(i) ${{\log }_{a}}1=0$ because ${{a}^{0}}=1$ .
(ii) ${{\log }_{a}}~a\text{ }=\text{ }1$ because ${{a}^{1}}=a$ .
(iii) ${{\log }_{a}}{{a}^{x}}=x$ .
(iv) ${{\log }_{a}}x={{\log }_{a}}y\Rightarrow x=y$ .
(v) ${{\log }_{a}}x={{\log }_{b}}x\Rightarrow a=b$ .
Common logarithm has base 10 represented by $\log x$ .
Natural logarithm has a base $e$ represented by $\ln x$ .
Here we need to draw a graph of common logarithms.
Note: For answering questions based on logarithm functions we use different formulae like
$\log \left( ab \right)=\log a+\log b$, $\log \left( \dfrac{a}{b} \right)=\log a-\log b$ and many more. The logarithm properties give that $\ln e=1$ and $\log 10=1$ . There is also one special property given as ${{\log }_{a}}b=\dfrac{\log b}{\log a}$ and ${{\log }_{a}}b=\dfrac{1}{{{\log }_{b}}a}$ . As this is an inverse function we can say that ${{\log }_{a}}\left( {{x}^{n}} \right)=n{{\log }_{a}}x$ and ${{\log }_{a}}\left( \sqrt[n]{x} \right)=\dfrac{1}{n}{{\log }_{a}}x$ . We can say ${{a}^{{{\log }_{a}}x}}=x$ and ${{\log }_{a}}0=\left\{ \begin{matrix}
-\infty \text{ when a > 1} \\
\infty \text{ when a < 1} \\
\end{matrix} \right\}$ . We have another formulae saying that ${{\log }_{{{a}^{m}}}}{{a}^{n}}=\dfrac{n}{m}$ for $m\ne 0$ .
Recently Updated Pages
Master Class 10 Computer Science: Engaging Questions & Answers for Success
Master Class 10 General Knowledge: Engaging Questions & Answers for Success
Master Class 10 English: Engaging Questions & Answers for Success
Master Class 10 Social Science: Engaging Questions & Answers for Success
Master Class 10 Maths: Engaging Questions & Answers for Success
Master Class 10 Science: Engaging Questions & Answers for Success
Trending doubts
What is the median of the first 10 natural numbers class 10 maths CBSE
Which women's tennis player has 24 Grand Slam singles titles?
Who is the Brand Ambassador of Incredible India?
Why is there a time difference of about 5 hours between class 10 social science CBSE
Write a letter to the principal requesting him to grant class 10 english CBSE
State and prove converse of BPT Basic Proportionality class 10 maths CBSE