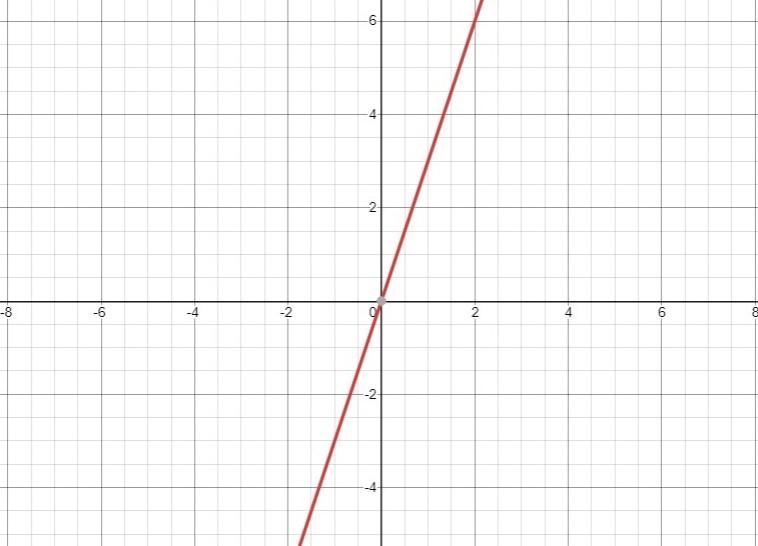
Draw the graph of the equation \[y = 3x\]
Answer
589.8k+ views
Hint:Take a graph of scale 1 or 2 and try to draw this, first of all, check for some value like what will be the value of y when the value of x is 0, 1 or -1 take some more figure if you want.
Complete step by step answer:
Let us try to draw a take to optimize the change of the value of y in terms of x
Now plot the points (0,0), (1,3), (-1,3) you may take more points if you want but these 3 points will be sufficient enough to draw a graph.
The graph will somehow look like

The Graph will be a straight line like this one.
It was a linear equation which means that the figure will only cut the x-axis once. If it would have been a quadratic equation it will be a curve which will cut the x-axis twice for cubic also it will be a curve cutting the x-axis thrice and so on.
Note:
It must be noted that only linear equations produce straight line all the other degree polynomials will give different types of curves depending on how many times they are intersecting on the axes.
Complete step by step answer:
Let us try to draw a take to optimize the change of the value of y in terms of x
| x | 0 | -1 | 1 | 2 | -2 |
| y | 0 | -3 | 3 | 6 | -6 |
Now plot the points (0,0), (1,3), (-1,3) you may take more points if you want but these 3 points will be sufficient enough to draw a graph.
The graph will somehow look like

The Graph will be a straight line like this one.
It was a linear equation which means that the figure will only cut the x-axis once. If it would have been a quadratic equation it will be a curve which will cut the x-axis twice for cubic also it will be a curve cutting the x-axis thrice and so on.
Note:
It must be noted that only linear equations produce straight line all the other degree polynomials will give different types of curves depending on how many times they are intersecting on the axes.
Recently Updated Pages
Master Class 10 Computer Science: Engaging Questions & Answers for Success

Master Class 10 General Knowledge: Engaging Questions & Answers for Success

Master Class 10 English: Engaging Questions & Answers for Success

Master Class 10 Social Science: Engaging Questions & Answers for Success

Master Class 10 Maths: Engaging Questions & Answers for Success

Master Class 10 Science: Engaging Questions & Answers for Success

Trending doubts
What is the median of the first 10 natural numbers class 10 maths CBSE

Which women's tennis player has 24 Grand Slam singles titles?

Who is the Brand Ambassador of Incredible India?

Why is there a time difference of about 5 hours between class 10 social science CBSE

Write a letter to the principal requesting him to grant class 10 english CBSE

A moving boat is observed from the top of a 150 m high class 10 maths CBSE


