


Draw the graph of $xy\ \ =\ \ 20$ where $ x , y > 0 $. Use the graph to find ${{y}_{1}}$ when $x\ =\ 5$ , and to find ${{x}_{1}}$ when $y\ =\ 10$ . Then find ${{x}_{1}}\ +\ {{y}_{1}}$ .\[\]
Answer
584.7k+ views
Hint: We see that the given equation of curve is in implicit form $xy\ \ =\ \ 20$ we write it in the explicit form of function $y=f\left( x \right)=\dfrac{20}{x}$. We assume 3 positive values and 3 negative values for $x$. We find the corresponding functional values. $y=f\left( x \right)$ We find the coordinates of points $\left( x,f\left( x \right) \right)$ and join them to get the plot of the curve . We draw the lines $x\ =\ 5$ and the ordinate of its point of intersection with the curve $xy\ \ =\ \ 20$ will be ${{y}_{1}}$. We draw the lines $y\ =\ 10$ and abscissa of its point of intersection with the curve $xy\ \ =\ \ 20$ will be ${{x}_{1}}$. \[\]
Complete step-by-step answer:
We have the given equation of the curve in the question as
\[xy\ \ =\ \ 20\]
Here the condition is the non-negative constraints $ x , y > 0 $ which means the curve is only in first quadrant. We see that it is in implicit form which means it is not expressed in the form $y=f\left( x \right)$. We write explicitly in the form $y=f\left( x \right)$ as
\[\begin{align}
& xy=20 \\
& \Rightarrow y=\dfrac{20}{x} \\
& \Rightarrow y=f\left( x \right)=\dfrac{20}{x}....\left( 1 \right) \\
\end{align}\]
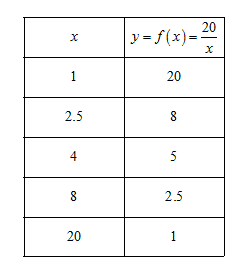
We can see that above function is clearly not defined for $x=0$ We see that $x$ and $y$ are multiplied to each other and the product is 20. We can take the factors of 20 as assumed integral values of $x$. We have the factors of 20 as 1,2,4,5,10,20. We take 5 values $x=1,2.5,4,8,20$ in equation and find the corresponding values of $y=f\left( x \right)=\dfrac{20}{x}$. We write the obtained values in the following table. \[\]
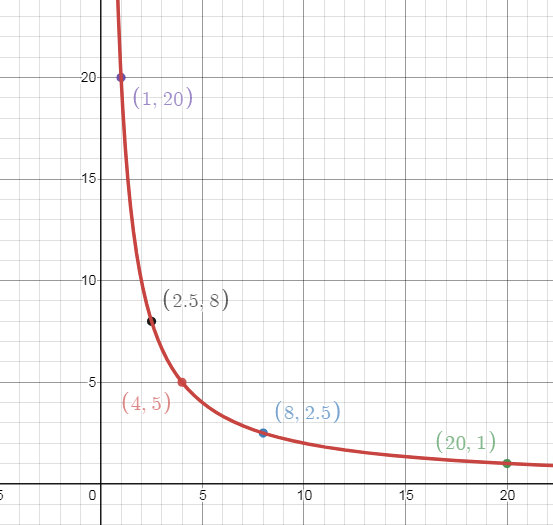
We plot the obtained points $\left( x,f\left( x \right) \right)$ and join the points to obtain the plot of the curve $xy=20$ with $x,y > 0 $\[\]
We are also asked to use the graph to find ${{y}_{1}}$ when $x=5$ , and to find ${{x}_{1}}$ when $y=10$ and then find ${{x}_{1}}+{{y}_{1}}$ . So we draw the lines $x=5$ and $y=10$ and then observe only the first quadrant as there are only positive values and see where the lines intersect the curve. \[\]
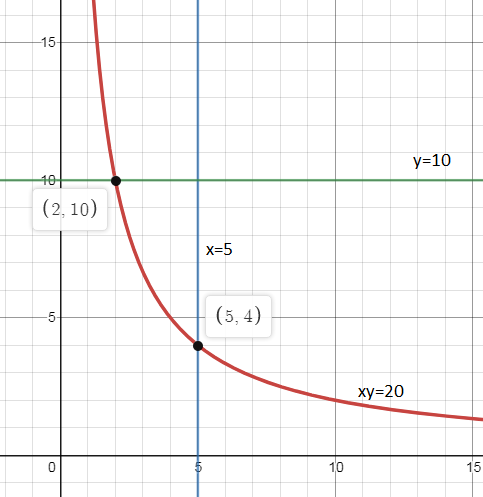
We observe that the line $x=4$ intersects the curve $xy=20$ at $\left( 5,4 \right)$, so when $x=4$ we have ${{y}_{1}}=4$. We also observe that the line $y=10$ intersects the curve at $\left( 2,10 \right)$, so when $y=10$ we have ${{x}_{1}}=2$. The required value from the question is ${{x}_{1}}+{{y}_{1}}=2+4=6$.\[\]
Note: We can verify the points of intersection by putting them in the equation of the curve. The plot we obtained is the plot of a rectangular hyperbola whose standard equation is given by $XY=C$ for some real constant $C$. The rectangular hyperbola is special type of hyperbola obtained when we put the condition $a=b$ in the general equation of an hyperbola $\dfrac{{{x}^{2}}}{{{a}^{2}}}-\dfrac{{{y}^{2}}}{{{b}^{2}}}=1$.
Complete step-by-step answer:
We have the given equation of the curve in the question as
\[xy\ \ =\ \ 20\]
Here the condition is the non-negative constraints $ x , y > 0 $ which means the curve is only in first quadrant. We see that it is in implicit form which means it is not expressed in the form $y=f\left( x \right)$. We write explicitly in the form $y=f\left( x \right)$ as
\[\begin{align}
& xy=20 \\
& \Rightarrow y=\dfrac{20}{x} \\
& \Rightarrow y=f\left( x \right)=\dfrac{20}{x}....\left( 1 \right) \\
\end{align}\]
We can see that above function is clearly not defined for $x=0$ We see that $x$ and $y$ are multiplied to each other and the product is 20. We can take the factors of 20 as assumed integral values of $x$. We have the factors of 20 as 1,2,4,5,10,20. We take 5 values $x=1,2.5,4,8,20$ in equation and find the corresponding values of $y=f\left( x \right)=\dfrac{20}{x}$. We write the obtained values in the following table. \[\]
We plot the obtained points $\left( x,f\left( x \right) \right)$ and join the points to obtain the plot of the curve $xy=20$ with $x,y > 0 $\[\]
We are also asked to use the graph to find ${{y}_{1}}$ when $x=5$ , and to find ${{x}_{1}}$ when $y=10$ and then find ${{x}_{1}}+{{y}_{1}}$ . So we draw the lines $x=5$ and $y=10$ and then observe only the first quadrant as there are only positive values and see where the lines intersect the curve. \[\]
We observe that the line $x=4$ intersects the curve $xy=20$ at $\left( 5,4 \right)$, so when $x=4$ we have ${{y}_{1}}=4$. We also observe that the line $y=10$ intersects the curve at $\left( 2,10 \right)$, so when $y=10$ we have ${{x}_{1}}=2$. The required value from the question is ${{x}_{1}}+{{y}_{1}}=2+4=6$.\[\]
Note: We can verify the points of intersection by putting them in the equation of the curve. The plot we obtained is the plot of a rectangular hyperbola whose standard equation is given by $XY=C$ for some real constant $C$. The rectangular hyperbola is special type of hyperbola obtained when we put the condition $a=b$ in the general equation of an hyperbola $\dfrac{{{x}^{2}}}{{{a}^{2}}}-\dfrac{{{y}^{2}}}{{{b}^{2}}}=1$.
Recently Updated Pages
Master Class 10 Computer Science: Engaging Questions & Answers for Success
Master Class 10 General Knowledge: Engaging Questions & Answers for Success
Master Class 10 English: Engaging Questions & Answers for Success
Master Class 10 Social Science: Engaging Questions & Answers for Success
Master Class 10 Maths: Engaging Questions & Answers for Success
Master Class 10 Science: Engaging Questions & Answers for Success
Trending doubts
What is the median of the first 10 natural numbers class 10 maths CBSE
Which women's tennis player has 24 Grand Slam singles titles?
Who is the Brand Ambassador of Incredible India?
Why is there a time difference of about 5 hours between class 10 social science CBSE
Write a letter to the principal requesting him to grant class 10 english CBSE
A moving boat is observed from the top of a 150 m high class 10 maths CBSE