


Draw the graph of $ y=x^3$
Answer
585.6k+ views
Hint: In order to draw the graph for any equation we need to find the local maxima and local minima and where it touches the x-axis and y-axis. Also take some sets of (x,y) by taking x as(-2,-1,0,1,2) to see how a certain graph is going up or down and also find the inflection points.
Complete step-by-step solution:
Given that the graph is $ y=x^3$
So let us find the values of local minima and maxima of the function $f(x) = x^3$
We know that for a point to be a local maxima or local minima$f'(x)$ must be zero and $f''$ (x) should not be zero
Which implies $f'$(x)=$\dfrac{d}{{dx}}({x^3}) = 3x^2 = 0$ which implies $x=0$
but $f''$ (x) = $\dfrac{{{d^2}}}{{d{x^2}}}({x^3}) = 6x$ should not be zero which implies x should not be zero
This says that there are no local minima or local maxima for the given function.
From the function $f'$(x) =$\dfrac{d}{{dx}}({x^3}) = 3x^2$ we got to know that derivative of the given fuction is always positive, which implies the given function is always increasing function.
At x=0 we got to know that both $f'(x)$ and $f''(x)$ are zero, which states that x = 0 is an inflection point for the given function .
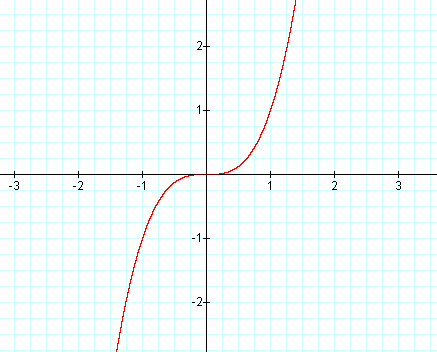
let us take some sets of the given function
They will be $(-2,-8) , (-1,-1) , (0,0) , (1,1) , (2,8)$
So the graph will be as shown below
Note: Don't just plot a few points and think you have the graph. Find all the things related to a graph which can change the certainty of the graph like inflection points local maxima and local minima and the intervals where the graph will be increasing or decreasing and so on…
Complete step-by-step solution:
Given that the graph is $ y=x^3$
So let us find the values of local minima and maxima of the function $f(x) = x^3$
We know that for a point to be a local maxima or local minima$f'(x)$ must be zero and $f''$ (x) should not be zero
Which implies $f'$(x)=$\dfrac{d}{{dx}}({x^3}) = 3x^2 = 0$ which implies $x=0$
but $f''$ (x) = $\dfrac{{{d^2}}}{{d{x^2}}}({x^3}) = 6x$ should not be zero which implies x should not be zero
This says that there are no local minima or local maxima for the given function.
From the function $f'$(x) =$\dfrac{d}{{dx}}({x^3}) = 3x^2$ we got to know that derivative of the given fuction is always positive, which implies the given function is always increasing function.
At x=0 we got to know that both $f'(x)$ and $f''(x)$ are zero, which states that x = 0 is an inflection point for the given function .
let us take some sets of the given function
They will be $(-2,-8) , (-1,-1) , (0,0) , (1,1) , (2,8)$
So the graph will be as shown below
Note: Don't just plot a few points and think you have the graph. Find all the things related to a graph which can change the certainty of the graph like inflection points local maxima and local minima and the intervals where the graph will be increasing or decreasing and so on…
Recently Updated Pages
Master Class 11 Computer Science: Engaging Questions & Answers for Success
Master Class 11 Business Studies: Engaging Questions & Answers for Success
Master Class 11 Economics: Engaging Questions & Answers for Success
Master Class 11 English: Engaging Questions & Answers for Success
Master Class 11 Maths: Engaging Questions & Answers for Success
Master Class 11 Biology: Engaging Questions & Answers for Success
Trending doubts
One Metric ton is equal to kg A 10000 B 1000 C 100 class 11 physics CBSE
There are 720 permutations of the digits 1 2 3 4 5 class 11 maths CBSE
Discuss the various forms of bacteria class 11 biology CBSE
Draw a diagram of a plant cell and label at least eight class 11 biology CBSE
State the laws of reflection of light
Explain zero factorial class 11 maths CBSE