


Draw the graphs of the following equations on the same graph paper:
$\begin{align}
& 2x+3y=12 \\
& x-y=1 \\
\end{align}$
Answer
610.8k+ views
Hint: Draw the graph of the two given equations. To draw the graph of a straight line, we need at least two points. So, choose one of the equations and substitute x = 0, determine y, then substitute y = 0, determine x. Now, apply the same process for the second equation. Plot the graph of the two equations using the points obtained.
Complete step-by-step answer:
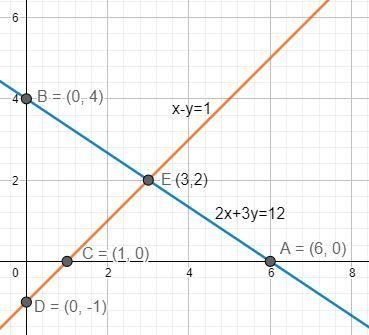
Let us assume the two equations as:
$\begin{align}
& 2x+3y=12..................(i) \\
& x-y=1........................(ii) \\
\end{align}$
Considering equation (i),
$2x+3y=12$
Substituting x = 0, we get,
\[\begin{align}
& 3y=12 \\
& \Rightarrow y=4 \\
\end{align}\]
Substituting y = 0, we get,
$\begin{align}
& 2x=12 \\
& \Rightarrow x=6 \\
\end{align}$
Therefore, the two points are: \[A\left( 6,0 \right)\text{ and }B\left( 0,4 \right)\].
Considering equation (ii),
\[x-y=1\]
Substituting x = 0, we get,
$\begin{align}
& -y=1 \\
& \Rightarrow y=-1 \\
\end{align}$
Substituting y = 0, we get,
$\Rightarrow x=1$
Therefore, the two points are: $C\left( 1,0 \right)\text{ and }D\left( 0,-1 \right)$.
Therefore, the graph of the two functions can be plotted as:
Note: One can also substitute the values of ‘x’ and ‘y’ other than 0 to draw the graph. The straight line will not change but only the marking of points will get changed. Generally, we substitute the value of ‘x’ and ‘y’ as 0 to make our calculation easy.
Complete step-by-step answer:
Let us assume the two equations as:
$\begin{align}
& 2x+3y=12..................(i) \\
& x-y=1........................(ii) \\
\end{align}$
Considering equation (i),
$2x+3y=12$
Substituting x = 0, we get,
\[\begin{align}
& 3y=12 \\
& \Rightarrow y=4 \\
\end{align}\]
Substituting y = 0, we get,
$\begin{align}
& 2x=12 \\
& \Rightarrow x=6 \\
\end{align}$
Therefore, the two points are: \[A\left( 6,0 \right)\text{ and }B\left( 0,4 \right)\].
Considering equation (ii),
\[x-y=1\]
Substituting x = 0, we get,
$\begin{align}
& -y=1 \\
& \Rightarrow y=-1 \\
\end{align}$
Substituting y = 0, we get,
$\Rightarrow x=1$
Therefore, the two points are: $C\left( 1,0 \right)\text{ and }D\left( 0,-1 \right)$.
Therefore, the graph of the two functions can be plotted as:
Note: One can also substitute the values of ‘x’ and ‘y’ other than 0 to draw the graph. The straight line will not change but only the marking of points will get changed. Generally, we substitute the value of ‘x’ and ‘y’ as 0 to make our calculation easy.
Recently Updated Pages
Master Class 10 Computer Science: Engaging Questions & Answers for Success
Master Class 10 General Knowledge: Engaging Questions & Answers for Success
Master Class 10 English: Engaging Questions & Answers for Success
Master Class 10 Social Science: Engaging Questions & Answers for Success
Master Class 10 Maths: Engaging Questions & Answers for Success
Master Class 10 Science: Engaging Questions & Answers for Success
Trending doubts
What is the median of the first 10 natural numbers class 10 maths CBSE
Which women's tennis player has 24 Grand Slam singles titles?
Who is the Brand Ambassador of Incredible India?
Why is there a time difference of about 5 hours between class 10 social science CBSE
Write a letter to the principal requesting him to grant class 10 english CBSE
A moving boat is observed from the top of a 150 m high class 10 maths CBSE