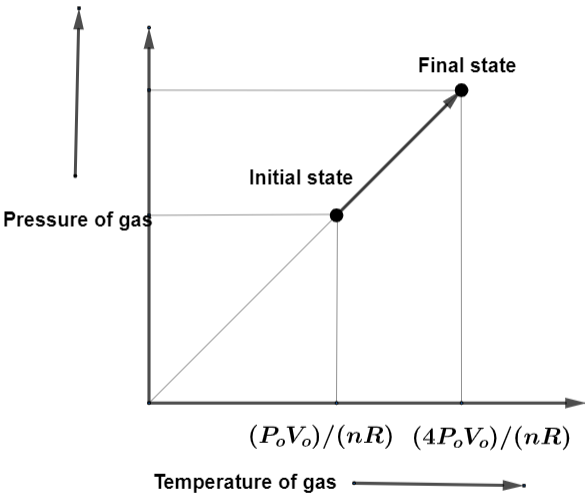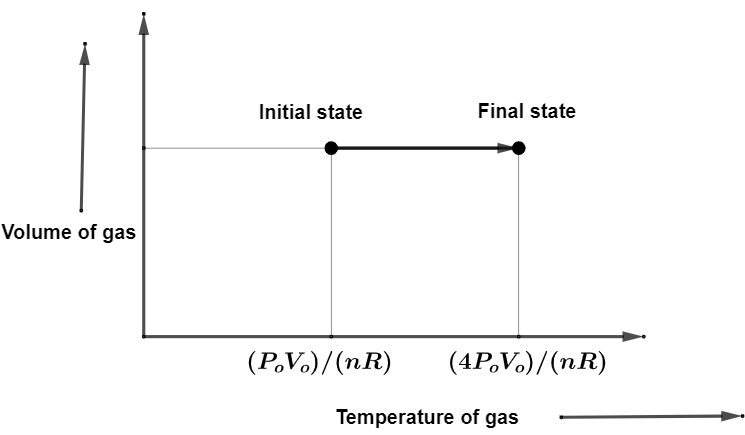
Draw the pressure-temperature and volume-temperature diagrams of an isochoric process of n moles of an ideal gas from pressure ${{P}_{\text{o}}}$, Volume ${{V}_{\text{o}}}$ to pressure $4{{P}_{\text{o}}}$ indicating the pressures and temperatures of the gas in the initial and the final state.
Answer
586.2k+ views
Hint: By the use of the equation of ideal gas we will solve the problem easily. As there are two values of pressure and volume given to us so, we will substitute these one by one in the equation of ideal gas and get the result. By the values of pressure we can draw graphs with initial and final states of gas.
Formula used:
$PV=nRT$, where P is pressure, T is temperature, R is gas constant and n is number of moles.
Complete answer:
Isochoric process: This term is used to describe a condition in which the volume of any process remains at its constant position.
As we know the ideal equation which is defined as $PV=nRT$. If an isochoric process is applied here then the V remains constant and this results into the pressure to be directly proportional to the temperature of the gas. Therefore, we get $P=\dfrac{nRT}{V}$.
So, according to the conditions given in the question, the pressure ${{P}_{\text{o}}}$, Volume ${{V}_{\text{o}}}$ gives ${{P}_{\text{o}}}=\dfrac{nRT}{{{V}_{\text{o}}}}$. This is going to be initial state of the gas with pressure as the pressure ${{P}_{\text{o}}}$and Volume ${{V}_{\text{o}}}$.
Also, the pressure $4{{P}_{\text{o}}}$, Volume ${{V}_{\text{o}}}$ gives $4{{P}_{\text{o}}}=\dfrac{nRT}{{{V}_{\text{o}}}}$. This is going to be initial state of the gas with pressure as the pressure $4{{P}_{\text{o}}}$ and Volume ${{V}_{\text{o}}}$. By getting the required initial state and final state of the gas, we can draw the graph for these.
According to this the graph of pressure-temperature is going to be,

Also, the graph of Volume-temperature is going to be,

Note:
The following points are utmost important to solve the question.
(1) The formula of ideal gas: $PV=nRT$.
(2) Initial state of gas when pressure ${{P}_{\text{o}}}$, Volume ${{V}_{\text{o}}}$ : ${{P}_{\text{o}}}=\dfrac{nRT}{{{V}_{\text{o}}}}$.
(3) Final state of gas when the pressure $4{{P}_{\text{o}}}$, Volume ${{V}_{\text{o}}}$ : $4{{P}_{\text{o}}}=\dfrac{nRT}{{{V}_{\text{o}}}}$.
(4) Volume constant: Pressure and temperature remains as direct proportional.
Formula used:
$PV=nRT$, where P is pressure, T is temperature, R is gas constant and n is number of moles.
Complete answer:
Isochoric process: This term is used to describe a condition in which the volume of any process remains at its constant position.
As we know the ideal equation which is defined as $PV=nRT$. If an isochoric process is applied here then the V remains constant and this results into the pressure to be directly proportional to the temperature of the gas. Therefore, we get $P=\dfrac{nRT}{V}$.
So, according to the conditions given in the question, the pressure ${{P}_{\text{o}}}$, Volume ${{V}_{\text{o}}}$ gives ${{P}_{\text{o}}}=\dfrac{nRT}{{{V}_{\text{o}}}}$. This is going to be initial state of the gas with pressure as the pressure ${{P}_{\text{o}}}$and Volume ${{V}_{\text{o}}}$.
Also, the pressure $4{{P}_{\text{o}}}$, Volume ${{V}_{\text{o}}}$ gives $4{{P}_{\text{o}}}=\dfrac{nRT}{{{V}_{\text{o}}}}$. This is going to be initial state of the gas with pressure as the pressure $4{{P}_{\text{o}}}$ and Volume ${{V}_{\text{o}}}$. By getting the required initial state and final state of the gas, we can draw the graph for these.
According to this the graph of pressure-temperature is going to be,

Also, the graph of Volume-temperature is going to be,

Note:
The following points are utmost important to solve the question.
(1) The formula of ideal gas: $PV=nRT$.
(2) Initial state of gas when pressure ${{P}_{\text{o}}}$, Volume ${{V}_{\text{o}}}$ : ${{P}_{\text{o}}}=\dfrac{nRT}{{{V}_{\text{o}}}}$.
(3) Final state of gas when the pressure $4{{P}_{\text{o}}}$, Volume ${{V}_{\text{o}}}$ : $4{{P}_{\text{o}}}=\dfrac{nRT}{{{V}_{\text{o}}}}$.
(4) Volume constant: Pressure and temperature remains as direct proportional.
Recently Updated Pages
Master Class 11 Computer Science: Engaging Questions & Answers for Success

Master Class 11 Business Studies: Engaging Questions & Answers for Success

Master Class 11 Economics: Engaging Questions & Answers for Success

Master Class 11 English: Engaging Questions & Answers for Success

Master Class 11 Maths: Engaging Questions & Answers for Success

Master Class 11 Biology: Engaging Questions & Answers for Success

Trending doubts
One Metric ton is equal to kg A 10000 B 1000 C 100 class 11 physics CBSE

There are 720 permutations of the digits 1 2 3 4 5 class 11 maths CBSE

Discuss the various forms of bacteria class 11 biology CBSE

Draw a diagram of a plant cell and label at least eight class 11 biology CBSE

State the laws of reflection of light

Explain zero factorial class 11 maths CBSE


