


Explain graphical method to determine energy of activation of a reaction.
Answer
503.4k+ views
Hint : Activation energy is the minimum energy required to convert the reactant molecules into the products and this could be calculated by using an equation which generally tells the relation of rate constant and temperature or activation energy which is the Arrhenius equation. Graphs based on this equation could help to find out the activation energy.
Complete Step By Step Answer:
In the given question, determination of activation energy is asked and that also by the graphical method. Firstly, we will get to know about the energy of activation of a reaction and then proceed to answer.
So, if there is a reaction and we want that reaction to occur, we will either provide heat or kinetic energy to the reactant molecule so that they get converted to products. This minimum amount of energy that must be provided to the reactants so that they get converted to products is called Activation energy.
Generally, a reaction is represented by its energy profile diagram which shows different information about the reaction like activation energy, spontaneity of reaction, reaction progress. The following diagram is representing the reaction energy profile: -
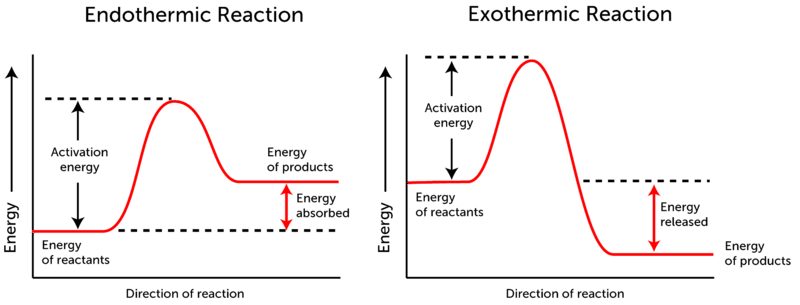
So, from this, the concept of activation energy could be well understood that energy required to cross this hump by the reactant molecules is activation energy.
Now, there is an equation called as Arrhenius equation which gives relation between activation energy and rate of reaction and temperature and the equation is: -
$ $ $ logK = \;-{\text{ }}\dfrac{{{E_a}}}{{2.303{\text{ }}RT}} + logA $
Where K = rate constant, $ {E_a} $ = activation energy, R = universal gas constant, T = temperature, A = pre-exponential Factor
So, rearranging this equation we can write as: -
$ logK = \;-{\text{ (}}\dfrac{{{E_a}}}{{2.303{\text{ }}R}})\dfrac{1}{T} + logA $
This becomes similar to the straight-line equation i.e. $ y{\text{ }} = {\text{ }}mx{\text{ }} + {\text{ }}c $
And if the graph is plotted between $ log{\text{ }}K $ and $ 1/T $ we will get the slope as $ - \dfrac{{{E_a}}}{{2.303R}} $ in which we know value of $ R $ (gas constant) and therefore, the activation energy could be calculated.
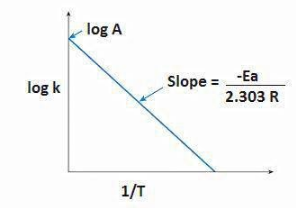
$ Slope = - \dfrac{{{E_a}}}{{2.303R}} \Rightarrow {\text{ }}{E_a} = - \;slope \times 2.303 \times R $
Hence, from the slope, the energy of activation can be calculated using this graphical method.
Note :
In this Arrhenius equation, there is a condition in which two rate constants and two temperatures are compared and the equation could be used to find out rate constant if rate constant at 1 particular temperature is given. There are other modifications in this equation as well which could invite different types of questions from the same equation. So, it is good to know how to attempt similar types of questions.
Complete Step By Step Answer:
In the given question, determination of activation energy is asked and that also by the graphical method. Firstly, we will get to know about the energy of activation of a reaction and then proceed to answer.
So, if there is a reaction and we want that reaction to occur, we will either provide heat or kinetic energy to the reactant molecule so that they get converted to products. This minimum amount of energy that must be provided to the reactants so that they get converted to products is called Activation energy.
Generally, a reaction is represented by its energy profile diagram which shows different information about the reaction like activation energy, spontaneity of reaction, reaction progress. The following diagram is representing the reaction energy profile: -
So, from this, the concept of activation energy could be well understood that energy required to cross this hump by the reactant molecules is activation energy.
Now, there is an equation called as Arrhenius equation which gives relation between activation energy and rate of reaction and temperature and the equation is: -
$ $ $ logK = \;-{\text{ }}\dfrac{{{E_a}}}{{2.303{\text{ }}RT}} + logA $
Where K = rate constant, $ {E_a} $ = activation energy, R = universal gas constant, T = temperature, A = pre-exponential Factor
So, rearranging this equation we can write as: -
$ logK = \;-{\text{ (}}\dfrac{{{E_a}}}{{2.303{\text{ }}R}})\dfrac{1}{T} + logA $
This becomes similar to the straight-line equation i.e. $ y{\text{ }} = {\text{ }}mx{\text{ }} + {\text{ }}c $
And if the graph is plotted between $ log{\text{ }}K $ and $ 1/T $ we will get the slope as $ - \dfrac{{{E_a}}}{{2.303R}} $ in which we know value of $ R $ (gas constant) and therefore, the activation energy could be calculated.
$ Slope = - \dfrac{{{E_a}}}{{2.303R}} \Rightarrow {\text{ }}{E_a} = - \;slope \times 2.303 \times R $
Hence, from the slope, the energy of activation can be calculated using this graphical method.
Note :
In this Arrhenius equation, there is a condition in which two rate constants and two temperatures are compared and the equation could be used to find out rate constant if rate constant at 1 particular temperature is given. There are other modifications in this equation as well which could invite different types of questions from the same equation. So, it is good to know how to attempt similar types of questions.
Recently Updated Pages
Master Class 11 Computer Science: Engaging Questions & Answers for Success
Master Class 11 Business Studies: Engaging Questions & Answers for Success
Master Class 11 Economics: Engaging Questions & Answers for Success
Master Class 11 English: Engaging Questions & Answers for Success
Master Class 11 Maths: Engaging Questions & Answers for Success
Master Class 11 Biology: Engaging Questions & Answers for Success
Trending doubts
One Metric ton is equal to kg A 10000 B 1000 C 100 class 11 physics CBSE
There are 720 permutations of the digits 1 2 3 4 5 class 11 maths CBSE
Discuss the various forms of bacteria class 11 biology CBSE
Draw a diagram of a plant cell and label at least eight class 11 biology CBSE
State the laws of reflection of light
Explain zero factorial class 11 maths CBSE