


Explain the difference between Orgel and Tanabe-Sugano diagrams?
Answer
489.6k+ views
Hint: Tanabe-Sugano diagrams are usually a part of coordination chemistry where they are extensively used in prediction of absorption in UV radiation, visible radiation as well as in the infrared spectrum. Orgel diagram is basically used to relate spin of the electrons in an atom.
Complete answer:
Orgel and Tanabe-Sugano diagrams both are used in chemistry but their field of specialization is completely different.
Orgel diagrams are drawn to determine the spin allowed transition of an electron. The Orgel diagram does not include ‘not spin-forbidden’ transitions. Orgel diagrams are used only for expressing transitions associated with high-spin transitions. Orgel diagram can be drawn for showing transition of high spin octahedral transition as well as high showing tetrahedral transition shown by metal ions.
Magnitude of splitting energy exerted by different ligands used in coordination compounds on The orbitals of metal ions is equivalent to the electron repulsion energy. If the splitting energy by ligands is somewhat lower than electron repulsion energy, then sensitivity of orgel diagram decreases.
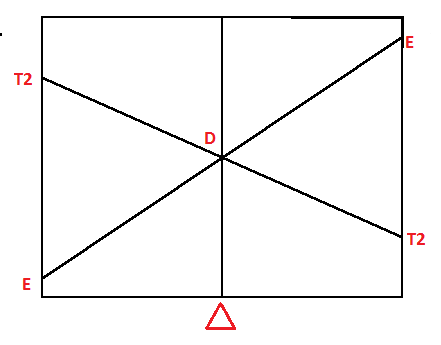
Diagram showing the orgel diagram
Tanabe-Sugano diagrams are also used in coordination chemistry to predict the transition of electrons from metal ions. It works on determining transitions based on the electromagnetic spectrum of the complex compounds. Tanabe-Sugano diagrams are capable of showing high spin transitions as well as low spin transitions associated with metal ions of coordination compounds. On drawing Tanabe-Sugano diagrams a ground state is considered which is used as a reference of transitions.
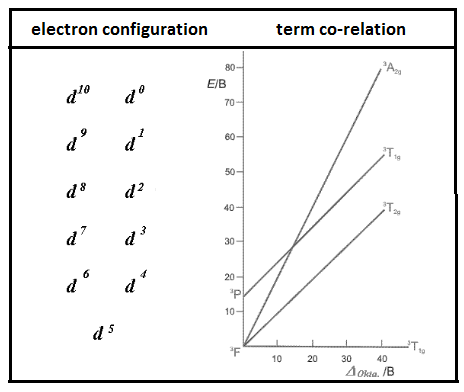
Diagram showing the Tanabe-Sugano diagram.
Hence, the main difference between Orgel and Tanabe-Sugano diagrams are-
Note:
Other important features of Tanabe-Sugano diagrams are that it is plotted between ligand field parameters on the x-axis and energy on the y-axis. It is used to distinguish the effect of transition under strong field ligands and weak field ligands.
Complete answer:
Orgel and Tanabe-Sugano diagrams both are used in chemistry but their field of specialization is completely different.
Orgel diagrams are drawn to determine the spin allowed transition of an electron. The Orgel diagram does not include ‘not spin-forbidden’ transitions. Orgel diagrams are used only for expressing transitions associated with high-spin transitions. Orgel diagram can be drawn for showing transition of high spin octahedral transition as well as high showing tetrahedral transition shown by metal ions.
Magnitude of splitting energy exerted by different ligands used in coordination compounds on The orbitals of metal ions is equivalent to the electron repulsion energy. If the splitting energy by ligands is somewhat lower than electron repulsion energy, then sensitivity of orgel diagram decreases.
Diagram showing the orgel diagram
Tanabe-Sugano diagrams are also used in coordination chemistry to predict the transition of electrons from metal ions. It works on determining transitions based on the electromagnetic spectrum of the complex compounds. Tanabe-Sugano diagrams are capable of showing high spin transitions as well as low spin transitions associated with metal ions of coordination compounds. On drawing Tanabe-Sugano diagrams a ground state is considered which is used as a reference of transitions.
Diagram showing the Tanabe-Sugano diagram.
Hence, the main difference between Orgel and Tanabe-Sugano diagrams are-
| ORGEL DIAGRAM | TANABE-SUGANO DIAGRAM |
| it does not include ‘not spin-forbidden’ transitions. | it includes ‘not spin-forbidden’ transitions. |
| It is associated with high spin transitions only. | It is associated with high spin transitions as well as low spin transitions. |
| There is no concept of ground state as reference. | There is the concept of ground state as reference. |
| sensitivity of orgel diagrams depends upon the splitting energy of ligand and electron repulsion energy. | sensitivity of tanabe-sugano diagrams does not depend upon the splitting energy of ligand and electron repulsion energy. |
Note:
Other important features of Tanabe-Sugano diagrams are that it is plotted between ligand field parameters on the x-axis and energy on the y-axis. It is used to distinguish the effect of transition under strong field ligands and weak field ligands.
Recently Updated Pages
Master Class 11 Computer Science: Engaging Questions & Answers for Success
Master Class 11 Business Studies: Engaging Questions & Answers for Success
Master Class 11 Economics: Engaging Questions & Answers for Success
Master Class 11 English: Engaging Questions & Answers for Success
Master Class 11 Maths: Engaging Questions & Answers for Success
Master Class 11 Biology: Engaging Questions & Answers for Success
Trending doubts
One Metric ton is equal to kg A 10000 B 1000 C 100 class 11 physics CBSE
There are 720 permutations of the digits 1 2 3 4 5 class 11 maths CBSE
Discuss the various forms of bacteria class 11 biology CBSE
Draw a diagram of a plant cell and label at least eight class 11 biology CBSE
State the laws of reflection of light
10 examples of friction in our daily life