


Figure shows the distance-time graph of three objects A, B and C. Study the graph and answer the following question:
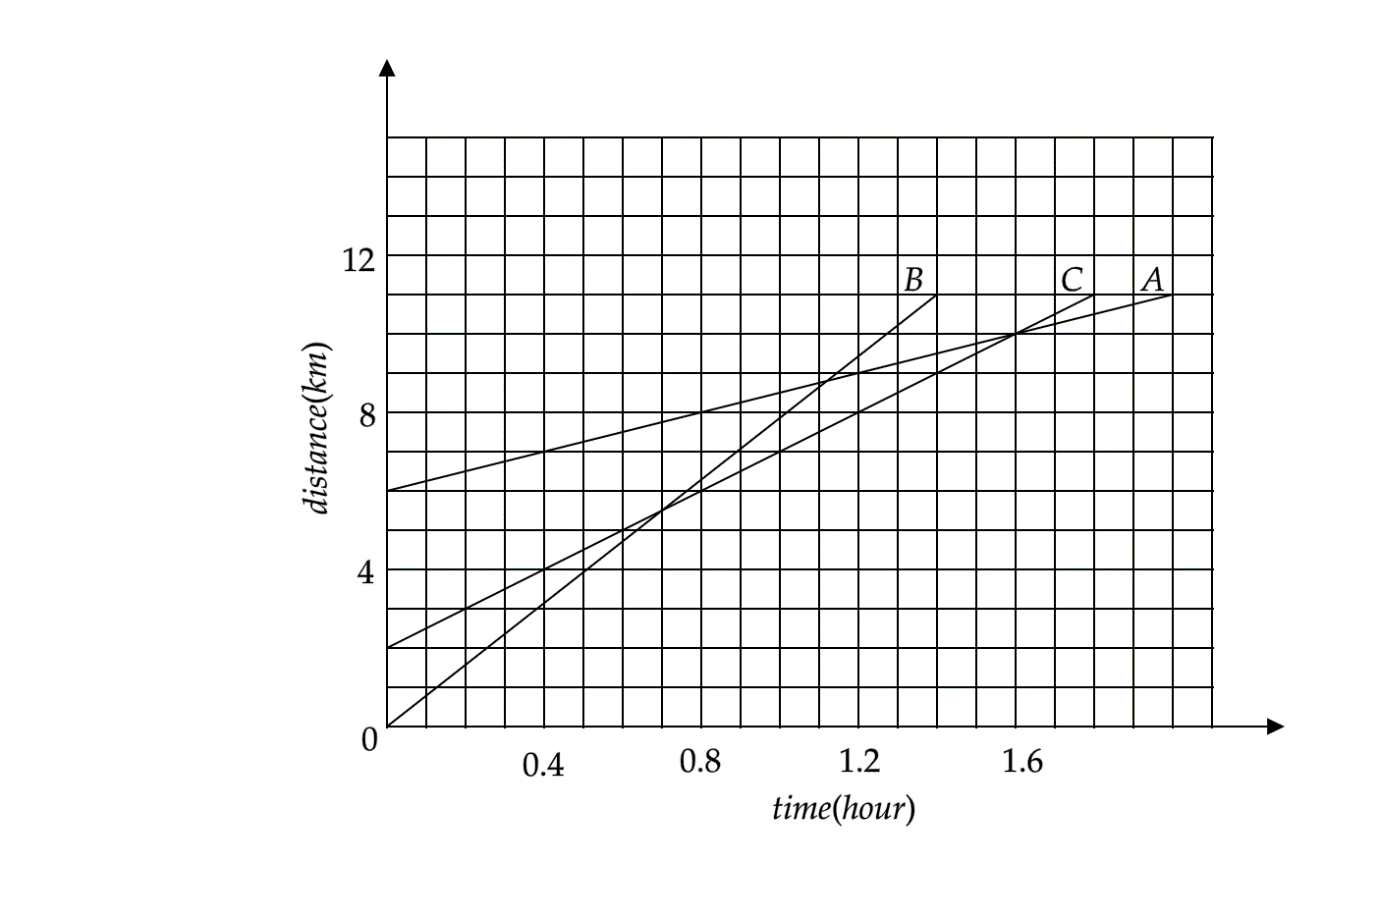
(a) Which of the three is travelling the fastest?
(b) Are all three ever at the same point on the road?
(c) How far has C travelled when B passes A?
(d) How far has B travelled by the time it passes C?
Answer
581.1k+ views
Hint
We have been given the graph that depicts the variation of distance with time. The area of the curve will not give us any valuable information as the product of distance and time is of no use to us. The slope of the lines, on the other hand, gives us the velocities with which the objects are moving. We can hence make use of the slope of the lines. Let’s proceed to a detailed solution.
Complete step by step answer
We have to find the distances travelled by objects when they cross each other. An object can be said to cross another object when the distance travelled by the two objects is the same, and we can find the distances by reading the data given on the y-axis of the graph. But first, we have to find the object that is moving the fastest, or in other words, has the greatest speed. As discussed in the hint section, the object whose line has the greatest slope will have the greatest velocity or speed. Analyse the graph given below
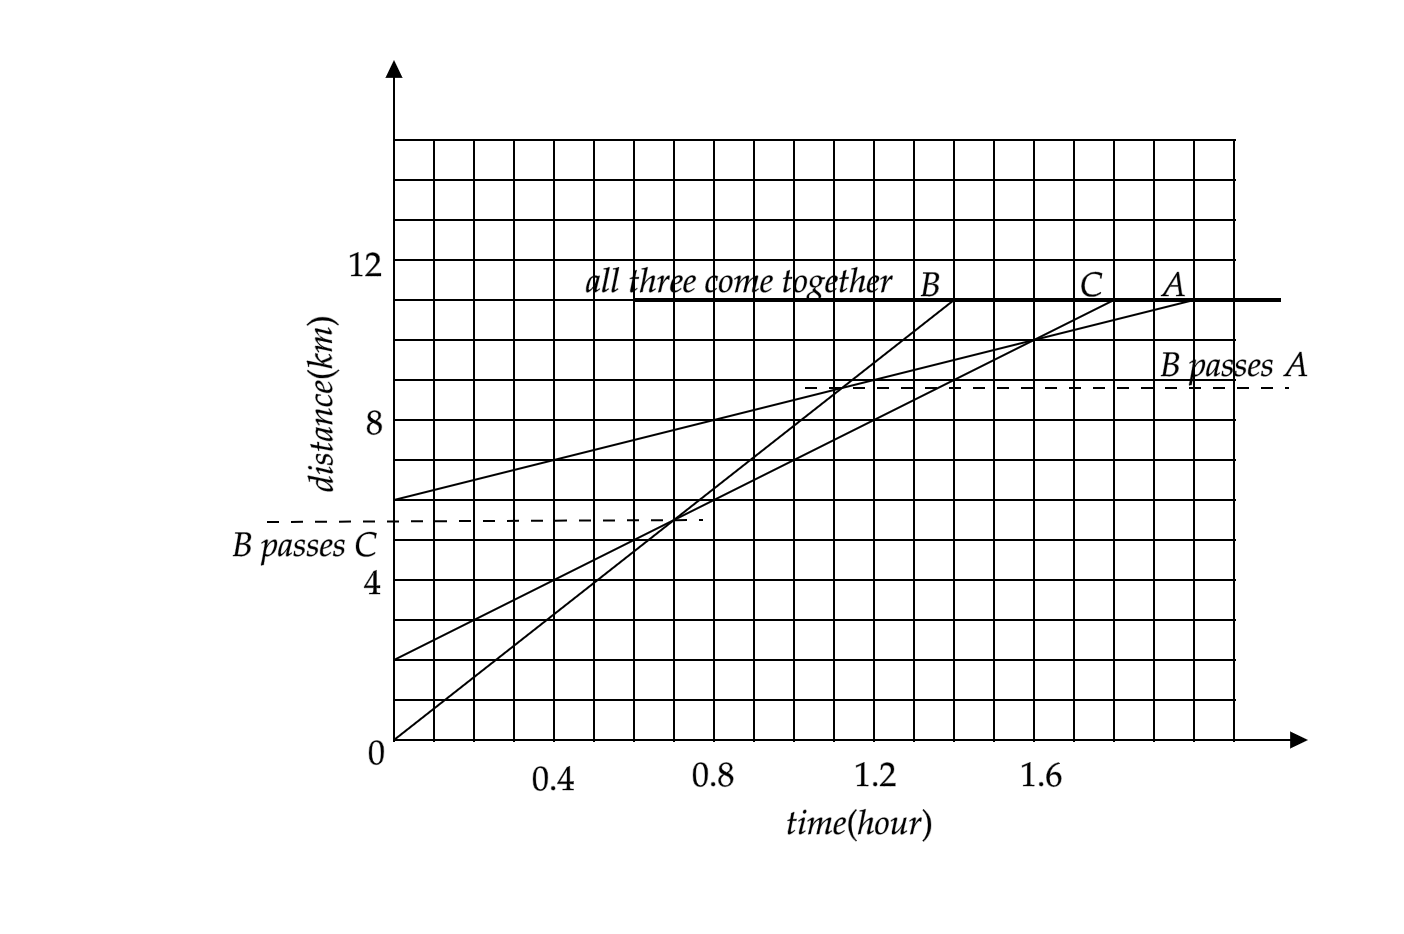
(a) We can see that B shows the steepest rise in the distance travelled in a given time. Hence we can say that object B moves the fastest.
(b) As discussed in the hint, objects will come together when the distance travelled by them is equal, irrespective of the time they take. The bold line that’s marked as ‘all three come together’ shows that there comes a point when the distance travelled by all the three objects is $11km$ . That is the point when the objects all come together.
From the graph, you can see that there are points marked with dotted lines that show points where B passes C and B passes A. By studying these dotted lines, we can answer our remaining questions.
(c) When B passes A, C has travelled approximately $9km$ .
(d) Similarly, we can say that by the time B passes C, it has travelled a distance of $5.5km$ .
Note
Here in the graph, all we had to do was mark the points where an object crosses another and then check the corresponding entry on the y-axis. But if the graph represented the variation of velocity with time, it would have been a bit more complex as you would have to find the area enclosed by the graph line to find the distance travelled. Therefore, be aware of the quantities provided in the graph. We were not asked the velocity of the fastest object hence we have simply said that B is the fastest.
We have been given the graph that depicts the variation of distance with time. The area of the curve will not give us any valuable information as the product of distance and time is of no use to us. The slope of the lines, on the other hand, gives us the velocities with which the objects are moving. We can hence make use of the slope of the lines. Let’s proceed to a detailed solution.
Complete step by step answer
We have to find the distances travelled by objects when they cross each other. An object can be said to cross another object when the distance travelled by the two objects is the same, and we can find the distances by reading the data given on the y-axis of the graph. But first, we have to find the object that is moving the fastest, or in other words, has the greatest speed. As discussed in the hint section, the object whose line has the greatest slope will have the greatest velocity or speed. Analyse the graph given below
(a) We can see that B shows the steepest rise in the distance travelled in a given time. Hence we can say that object B moves the fastest.
(b) As discussed in the hint, objects will come together when the distance travelled by them is equal, irrespective of the time they take. The bold line that’s marked as ‘all three come together’ shows that there comes a point when the distance travelled by all the three objects is $11km$ . That is the point when the objects all come together.
From the graph, you can see that there are points marked with dotted lines that show points where B passes C and B passes A. By studying these dotted lines, we can answer our remaining questions.
(c) When B passes A, C has travelled approximately $9km$ .
(d) Similarly, we can say that by the time B passes C, it has travelled a distance of $5.5km$ .
Note
Here in the graph, all we had to do was mark the points where an object crosses another and then check the corresponding entry on the y-axis. But if the graph represented the variation of velocity with time, it would have been a bit more complex as you would have to find the area enclosed by the graph line to find the distance travelled. Therefore, be aware of the quantities provided in the graph. We were not asked the velocity of the fastest object hence we have simply said that B is the fastest.
Recently Updated Pages
Master Class 11 Computer Science: Engaging Questions & Answers for Success
Master Class 11 Business Studies: Engaging Questions & Answers for Success
Master Class 11 Economics: Engaging Questions & Answers for Success
Master Class 11 English: Engaging Questions & Answers for Success
Master Class 11 Maths: Engaging Questions & Answers for Success
Master Class 11 Biology: Engaging Questions & Answers for Success
Trending doubts
One Metric ton is equal to kg A 10000 B 1000 C 100 class 11 physics CBSE
There are 720 permutations of the digits 1 2 3 4 5 class 11 maths CBSE
Discuss the various forms of bacteria class 11 biology CBSE
Draw a diagram of a plant cell and label at least eight class 11 biology CBSE
State the laws of reflection of light
Explain zero factorial class 11 maths CBSE