


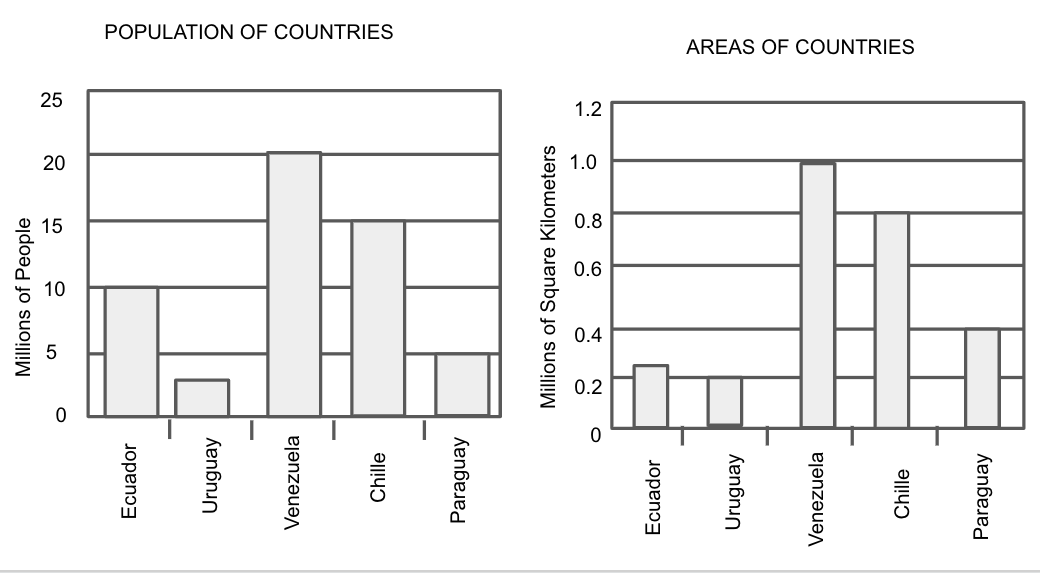
Find the country with the highest population density defined as \[\dfrac{{{\text{Population}}}}{{{\text{Density}}}}\].
A. Ecuador
B.Uruguay
C.Venezuela
D.Chile
Answer
577.8k+ views
Hint: Here, we from the formula of finding highest population density is defined as \[\dfrac{{{\text{Population}}}}{{{\text{Density}}}}\]. Then we will substitute the values from the given graphs of Ecuador, Uruguay, Venezuela and Chile separately and then compare the values to find the highest one.
Complete step-by-step answer:
We are given that the country with highest population density is defined as \[\dfrac{{{\text{Population}}}}{{{\text{Density}}}}\].
Consider Ecuador,
Since from the given graph, we will find the population and density of Ecuador, we get
\[ \Rightarrow Population = 10\]
\[ \Rightarrow Density = 0.3\]
We will compute population density of Ecuador from the above values using the given formula, we get
\[
\Rightarrow \dfrac{{10}}{{0.3}} \\
\Rightarrow 33.34{\text{ million people per million sq km}} \\
\]
Consider Uruguay,
Since from the given graph, we will find the population and density of Uruguay, we get
\[ \Rightarrow Population = 2.5\]
\[ \Rightarrow Density = 0.2\]
We will compute population density of Uruguay from the above values using the given formula, we get
\[
\Rightarrow \dfrac{{2.5}}{{0.2}} \\
\Rightarrow 12.5{\text{ million people per million sq km}} \\
\]
Consider Venezuela,
Since from the given graph, we will find the population and density of Venezuela, we get
\[ \Rightarrow Population = 20\]
\[ \Rightarrow Density = 1\]
We will compute population density of Venezuela from the above values using the given formula, we get
\[
\Rightarrow \dfrac{{20}}{1} \\
\Rightarrow 20{\text{ million people per million sq km}} \\
\]
Consider Chile,
Since from the given graph, we will find the population and density of Chile, we get
\[ \Rightarrow Population = 15\]
\[ \Rightarrow Density = 0.8\]
We will compute population density of Chile from the above values using the given formula, we get
\[
\Rightarrow \dfrac{{15}}{{0.8}} \\
\Rightarrow 18.75{\text{ million people per million sq km}} \\
\]
So, after comparing the case, we get that the population of Ecuador has the highest population density.
Hence, option A is correct.
Note: Students need to know that a bar graph can be defined as a chart or a graphical representation of data, quantities or numbers using bars or strips. So we use these graphs to compare and contrast numbers, frequencies or other measures of distinct categories of data. We should know that what is asked in question properly, we will find the sum of frequencies of bars on left not right. So be careful with that.
Recently Updated Pages
Master Class 8 Social Science: Engaging Questions & Answers for Success
Master Class 8 English: Engaging Questions & Answers for Success
Class 8 Question and Answer - Your Ultimate Solutions Guide
Master Class 8 Maths: Engaging Questions & Answers for Success
Master Class 8 Science: Engaging Questions & Answers for Success
Master Class 9 General Knowledge: Engaging Questions & Answers for Success
Trending doubts
What is BLO What is the full form of BLO class 8 social science CBSE
Citizens of India can vote at the age of A 18 years class 8 social science CBSE
Full form of STD, ISD and PCO
Advantages and disadvantages of science
Right to vote is a AFundamental Right BFundamental class 8 social science CBSE
What are the 12 elements of nature class 8 chemistry CBSE