


Find the interquartile range of the o-give.
Answer
579k+ views
Hint: We observe the given o-give and find that we are given the median, the lower quartile ${{Q}_{1}}$, the upper quartile ${{Q}_{3}}$. We use the fact that interquartile range $IQR$ is different from upper and lower quartile which is given by $IQR={{Q}_{3}}-{{Q}_{1}}$\[\].
Complete step-by-step solution:
We know that cumulative frequency ${{f}_{n}}$ of a class interval ${{I}_{c}}$ is sum of frequency of ${{I}_{n}}$ and frequencies of all class intervals before ${{I}_{n}}$ which means
\[{{f}_{c}}=\sum\limits_{i=1}^{c}{{{f}_{i}}}\]
We know that ogive is a free hand-drawn curve to determine how much data values lie above or below a particular value in the sample population. The upper limits of the class interval are marked on the horizontal axis of the graph. The absolute or cumulative relative frequencies are marked right above with respect to the vertical axis and a plot is drawn with freehand. \[\]
We know in order statistics that the median is the middle of the data sample which separates the upper half and the lower half of the data in ascending order. It means 50% of the data lie below the median.\[\]
The quartiles are quantiles which divide the data into four parts. The first or lower quartile is the middle value between the smallest value in the data and the median. It is denoted by ${{Q}_{1}}$. The second quartile is the median itself and is denoted by ${{Q}_{2}}$. The third or highest quartile is the middle value between the median and the highest value and is denoted by ${{Q}_{3}}$. The interquartile range $IQR$ is the difference between the highest and lowest quartile. So we have
\[r={{Q}_{3}}-{{Q}_{1}}\]
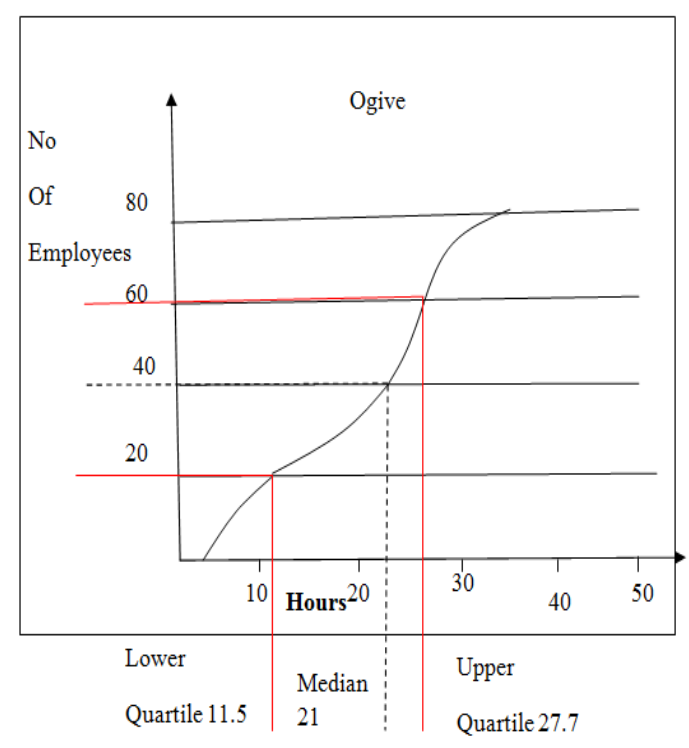
We observe the given o-give and find that we are given the lowest quartile ${{Q}_{1}}=11.5$, the median ${{Q}_{2}}=21$ and highest quartile ${{Q}_{3}}=27.7$. So the interquartile range is \[IQR={{Q}_{3}}-{{Q}_{1}}=27.7-11.5=16.2\]
Note: We note that the quantile is a data point, which divides the data into equal parts. We get only one quantile called median when we divide the data into two equal parts. The percentile like quartile divides the data into a hundred parts.
Complete step-by-step solution:
We know that cumulative frequency ${{f}_{n}}$ of a class interval ${{I}_{c}}$ is sum of frequency of ${{I}_{n}}$ and frequencies of all class intervals before ${{I}_{n}}$ which means
\[{{f}_{c}}=\sum\limits_{i=1}^{c}{{{f}_{i}}}\]
We know that ogive is a free hand-drawn curve to determine how much data values lie above or below a particular value in the sample population. The upper limits of the class interval are marked on the horizontal axis of the graph. The absolute or cumulative relative frequencies are marked right above with respect to the vertical axis and a plot is drawn with freehand. \[\]
We know in order statistics that the median is the middle of the data sample which separates the upper half and the lower half of the data in ascending order. It means 50% of the data lie below the median.\[\]
The quartiles are quantiles which divide the data into four parts. The first or lower quartile is the middle value between the smallest value in the data and the median. It is denoted by ${{Q}_{1}}$. The second quartile is the median itself and is denoted by ${{Q}_{2}}$. The third or highest quartile is the middle value between the median and the highest value and is denoted by ${{Q}_{3}}$. The interquartile range $IQR$ is the difference between the highest and lowest quartile. So we have
\[r={{Q}_{3}}-{{Q}_{1}}\]
We observe the given o-give and find that we are given the lowest quartile ${{Q}_{1}}=11.5$, the median ${{Q}_{2}}=21$ and highest quartile ${{Q}_{3}}=27.7$. So the interquartile range is \[IQR={{Q}_{3}}-{{Q}_{1}}=27.7-11.5=16.2\]
Note: We note that the quantile is a data point, which divides the data into equal parts. We get only one quantile called median when we divide the data into two equal parts. The percentile like quartile divides the data into a hundred parts.
Recently Updated Pages
Master Class 10 Computer Science: Engaging Questions & Answers for Success
Master Class 10 General Knowledge: Engaging Questions & Answers for Success
Master Class 10 English: Engaging Questions & Answers for Success
Master Class 10 Social Science: Engaging Questions & Answers for Success
Master Class 10 Maths: Engaging Questions & Answers for Success
Master Class 10 Science: Engaging Questions & Answers for Success
Trending doubts
What is the median of the first 10 natural numbers class 10 maths CBSE
Which women's tennis player has 24 Grand Slam singles titles?
Who is the Brand Ambassador of Incredible India?
Why is there a time difference of about 5 hours between class 10 social science CBSE
Write a letter to the principal requesting him to grant class 10 english CBSE
A moving boat is observed from the top of a 150 m high class 10 maths CBSE