


How do you find the slope and intercept of \[y = 3x - 8\] ?
Answer
530.4k+ views
Hint: Here in this question, we have to plot the graph for the equation using the slope and the intercept. By substituting the x is equal to zero we can find the y intercept value and substituting y is equal to zero we can find the x intercept value. By equating the given equation to the general equation of line we can determine the slope.
Complete step by step solution:
The given equation is in the form of \[y = mx + b\] , where m is slope and b is known as y-intercept. Slope means ratio of vertical change to the horizontal change i.e., ratio of change in y-axis or step size of y-axis to the change in x-axis or step size of x-axis. An intercept is a point where the straight line or a curve intersects the y-axis in a plane. If the point x is zero then the obtained point is a y -intercept.
Now consider the given equation \[y = 3x - 8\] -----------(1)
Substitute the value of x as 0 in equation (1), then we have
\[ \Rightarrow y = 3(0) - 8\]
On simplifying we get
\[ \Rightarrow y = - 8\]
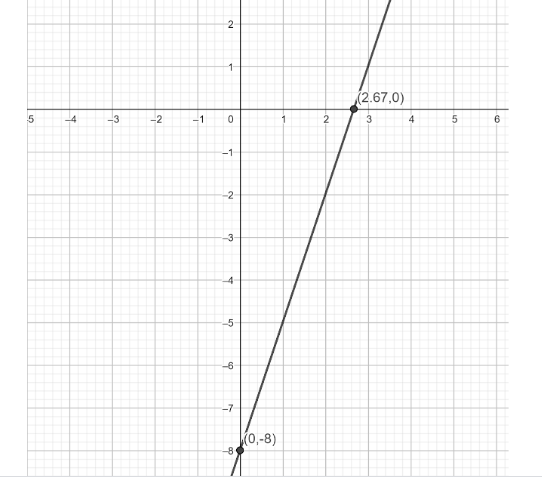
Therefore, y-intercept is (0,-8)
Substitute the value of y as 0 in the equation (1) then we have
\[ \Rightarrow 0 = 3x - 8\]
On simplifying we get
\[
\Rightarrow 8 = 3x \\
\Rightarrow x = \dfrac{8}{3} \\
\Rightarrow x = 2.67 \;
\]
We round of the number and write as x=2.7
Therefore, x-intercept is (2.7, 0)
The general equation of a line is given by \[y = mx + b\] , the b is the y-intercept and it is -3. On substituting we get \[y = mx - 8\] ------ (2)
On comparing the equation (1) and equation (2) we get
\[m = 3\]
Therefore, the slope is \[3\]
The graph for this is given below
Note: The question is belonging to the concept of graph. By comparing the given equation to the equation of a line we calculate the slope and intercept. Or by choosing the value of x we can determine the value of y and then plotting the graphs for these points we obtain the result.
Complete step by step solution:
The given equation is in the form of \[y = mx + b\] , where m is slope and b is known as y-intercept. Slope means ratio of vertical change to the horizontal change i.e., ratio of change in y-axis or step size of y-axis to the change in x-axis or step size of x-axis. An intercept is a point where the straight line or a curve intersects the y-axis in a plane. If the point x is zero then the obtained point is a y -intercept.
Now consider the given equation \[y = 3x - 8\] -----------(1)
Substitute the value of x as 0 in equation (1), then we have
\[ \Rightarrow y = 3(0) - 8\]
On simplifying we get
\[ \Rightarrow y = - 8\]
Therefore, y-intercept is (0,-8)
Substitute the value of y as 0 in the equation (1) then we have
\[ \Rightarrow 0 = 3x - 8\]
On simplifying we get
\[
\Rightarrow 8 = 3x \\
\Rightarrow x = \dfrac{8}{3} \\
\Rightarrow x = 2.67 \;
\]
We round of the number and write as x=2.7
Therefore, x-intercept is (2.7, 0)
The general equation of a line is given by \[y = mx + b\] , the b is the y-intercept and it is -3. On substituting we get \[y = mx - 8\] ------ (2)
On comparing the equation (1) and equation (2) we get
\[m = 3\]
Therefore, the slope is \[3\]
The graph for this is given below
Note: The question is belonging to the concept of graph. By comparing the given equation to the equation of a line we calculate the slope and intercept. Or by choosing the value of x we can determine the value of y and then plotting the graphs for these points we obtain the result.

Recently Updated Pages
Master Class 11 English: Engaging Questions & Answers for Success
Master Class 11 Maths: Engaging Questions & Answers for Success
Master Class 11 Biology: Engaging Questions & Answers for Success
Master Class 11 Social Science: Engaging Questions & Answers for Success
Master Class 11 Physics: Engaging Questions & Answers for Success
Master Class 11 Accountancy: Engaging Questions & Answers for Success
Trending doubts
What is BLO What is the full form of BLO class 8 social science CBSE
Citizens of India can vote at the age of A 18 years class 8 social science CBSE
Full form of STD, ISD and PCO
Convert 40circ C to Fahrenheit A 104circ F B 107circ class 8 maths CBSE
Advantages and disadvantages of science
Right to vote is a AFundamental Right BFundamental class 8 social science CBSE