


For a stationary object, the acceleration-time graph
(A). Coincides with the time axis
(B). Is a straight line parallel to the time axis
(C). Is a straight line parallel to the acceleration axis
(D). Is a straight line with a positive slope
Answer
591.9k+ views
Hint: You can start by explaining the acceleration-time graph very briefly. Then calculate the value of acceleration at any time for this stationary body by using the equations $v = \dfrac{{dx}}{{dt}}$ and $a = \dfrac{{dv}}{{dt}}$. Then draw the acceleration-time graph and choose an option accordingly.
Complete step-by-step answer:
Graphs are a graphical representation of data, they are more relatable than written data.
Acceleration-time graphs are also similar, they show the acceleration of an object with respect to time. Here acceleration is shown in the y-axis and time is shown in the x-axis.
Now we are given a stationary object, so
\[dx = 0\]
We know that the velocity of an object with respect to time is given by an equation is
$v = \dfrac{{dx}}{{dt}} = 0$
We also know that the acceleration of an object with respect to time is given by an equation is
$a = \dfrac{{dv}}{{dt}} = 0$
So, what this equation tells us is that for any value of time, the acceleration will always remain zero. If we draw an acceleration time graph for a stationary object we get the following graph.
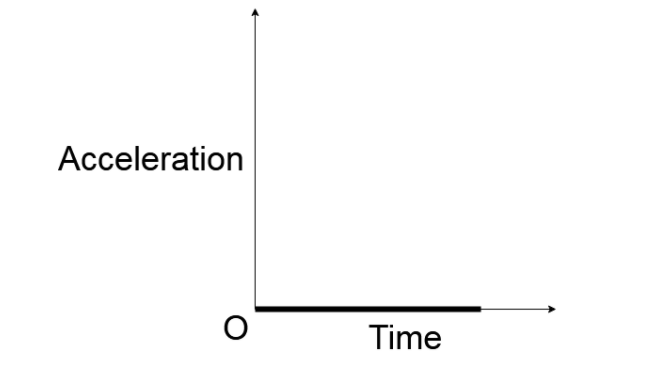
Here we see that the slope of the acceleration time graph for a stationary object coincides with the x-axis which as you may remember indicates the time.
Hence, option A is the correct choice.
Note: You can also reach the solution theoretically. It is very easy to understand that when we call a body stationary we mean that it has no velocity and if a body remains stationary only when no net external force (meaning no acceleration of the body) acts on the body. You can use this data to draw a graph and choose a suitable option.
Complete step-by-step answer:
Graphs are a graphical representation of data, they are more relatable than written data.
Acceleration-time graphs are also similar, they show the acceleration of an object with respect to time. Here acceleration is shown in the y-axis and time is shown in the x-axis.
Now we are given a stationary object, so
\[dx = 0\]
We know that the velocity of an object with respect to time is given by an equation is
$v = \dfrac{{dx}}{{dt}} = 0$
We also know that the acceleration of an object with respect to time is given by an equation is
$a = \dfrac{{dv}}{{dt}} = 0$
So, what this equation tells us is that for any value of time, the acceleration will always remain zero. If we draw an acceleration time graph for a stationary object we get the following graph.
Here we see that the slope of the acceleration time graph for a stationary object coincides with the x-axis which as you may remember indicates the time.
Hence, option A is the correct choice.
Note: You can also reach the solution theoretically. It is very easy to understand that when we call a body stationary we mean that it has no velocity and if a body remains stationary only when no net external force (meaning no acceleration of the body) acts on the body. You can use this data to draw a graph and choose a suitable option.
Recently Updated Pages
Master Class 11 Computer Science: Engaging Questions & Answers for Success
Master Class 11 Business Studies: Engaging Questions & Answers for Success
Master Class 11 Economics: Engaging Questions & Answers for Success
Master Class 11 English: Engaging Questions & Answers for Success
Master Class 11 Maths: Engaging Questions & Answers for Success
Master Class 11 Biology: Engaging Questions & Answers for Success
Trending doubts
One Metric ton is equal to kg A 10000 B 1000 C 100 class 11 physics CBSE
There are 720 permutations of the digits 1 2 3 4 5 class 11 maths CBSE
Discuss the various forms of bacteria class 11 biology CBSE
Draw a diagram of a plant cell and label at least eight class 11 biology CBSE
State the laws of reflection of light
Explain zero factorial class 11 maths CBSE