From the given bar graph, answer the following question-
In which section of class VII, the second highest strength of students are enrolled?


Answer
585.9k+ views
Hint: First convert the graphical date in sentence form. Then arrange the given number of students of different sections in descending order by first checking the ten’s digit then the one’s digit. Write the order and see which number is the second highest. Check this second highest number belongs to which section and you’ll have the answer.
Complete step-by-step answer:
Given bar graph is-

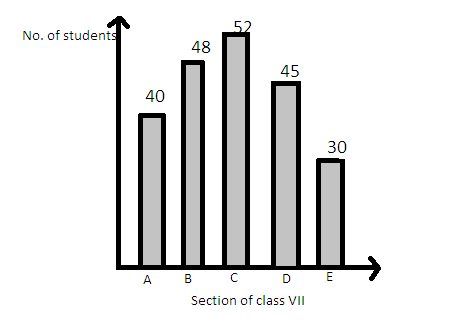
Here Y axis represents the number of students and X axis represents the sections of class VII.
It is given that the number of students in section A is $40$.
The number of students in section B is $48$.
The number of students in section C is $52$ .
The number of students in section D is $45$.
And the number of students in section E is $30$.
Now we have to find the section in which the second highest strength of students are enrolled.
First we will arrange the given numbers in descending order to determine the second highest strength.
Now in all these numbers first we will check the ten’s digit to see which is highest.
From the given numbers clearly $5$ is the highest of $52$ .
Now next there are three numbers having the same ten’s digit$4$. They are$40,48,45$.
So we will check the one’s digit to determine the highest in these three. Clearly $8$ is bigger than $0$ and $5$. So the second highest is $48$.
Now between $45$ and $40$ , $45$ is greater than $40$ as $5 > 0$. So $45$is the third highest and then next highest is $40$.
The last number $30$ is then obviously the smallest of the given numbers.
So the decreasing order is-$52 > 48 > 45 > 40 > 30$
Clearly the second highest is $48$ which is the number of students of section B.
Hence Section B is the second with second highest strength of students enrolled.
Note: Here you can also solve the question by checking the height of the columns drawn in the bar graph-
Clearly the section C in the middle has the greatest height in the bar graph. Then from observation it is clear that the second highest is the column of section B. The rest of the columns are smaller than the Column of section and we only had to find the second highest so no need to go further. Hence section B has the second highest strength of students enrolled.
Complete step-by-step answer:
Given bar graph is-

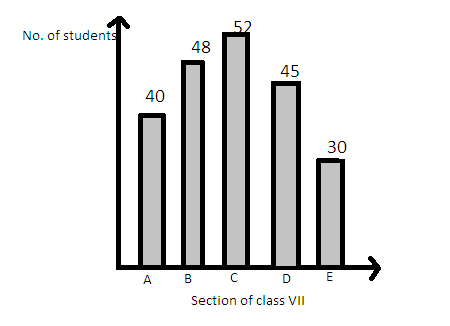
Here Y axis represents the number of students and X axis represents the sections of class VII.
It is given that the number of students in section A is $40$.
The number of students in section B is $48$.
The number of students in section C is $52$ .
The number of students in section D is $45$.
And the number of students in section E is $30$.
Now we have to find the section in which the second highest strength of students are enrolled.
First we will arrange the given numbers in descending order to determine the second highest strength.
Now in all these numbers first we will check the ten’s digit to see which is highest.
From the given numbers clearly $5$ is the highest of $52$ .
Now next there are three numbers having the same ten’s digit$4$. They are$40,48,45$.
So we will check the one’s digit to determine the highest in these three. Clearly $8$ is bigger than $0$ and $5$. So the second highest is $48$.
Now between $45$ and $40$ , $45$ is greater than $40$ as $5 > 0$. So $45$is the third highest and then next highest is $40$.
The last number $30$ is then obviously the smallest of the given numbers.
So the decreasing order is-$52 > 48 > 45 > 40 > 30$
Clearly the second highest is $48$ which is the number of students of section B.
Hence Section B is the second with second highest strength of students enrolled.
Note: Here you can also solve the question by checking the height of the columns drawn in the bar graph-
Clearly the section C in the middle has the greatest height in the bar graph. Then from observation it is clear that the second highest is the column of section B. The rest of the columns are smaller than the Column of section and we only had to find the second highest so no need to go further. Hence section B has the second highest strength of students enrolled.
Recently Updated Pages
Master Class 10 Computer Science: Engaging Questions & Answers for Success

Master Class 10 General Knowledge: Engaging Questions & Answers for Success

Master Class 10 English: Engaging Questions & Answers for Success

Master Class 10 Social Science: Engaging Questions & Answers for Success

Master Class 10 Maths: Engaging Questions & Answers for Success

Master Class 10 Science: Engaging Questions & Answers for Success

Trending doubts
What is the median of the first 10 natural numbers class 10 maths CBSE

Which women's tennis player has 24 Grand Slam singles titles?

Who is the Brand Ambassador of Incredible India?

Why is there a time difference of about 5 hours between class 10 social science CBSE

Write a letter to the principal requesting him to grant class 10 english CBSE

A moving boat is observed from the top of a 150 m high class 10 maths CBSE


