


Given a sub-divided bar graph which represents the production of wheat, oats and barley in three consecutive years, what is the percentage production of wheat in the year 1993?

$ a)40.55\%$
$ b)50.55\% $
$ c)45.55\% $
$ d)55.55\% $
Answer
578.1k+ views
Hint: Now we are given a graph representing production of wheat, oats and barley in three consecutive years. So we will calculate the production of wheat in the year 1993 as well as the total production in the year. Now percentage of wheat is given by $\dfrac{\text{production of wheat}}{\text{total production}}\times 100$
Complete step-by-step answer:
Now we have the given subdivided bar graph has the representation production of wheat, oats and barley in three consecutive years.
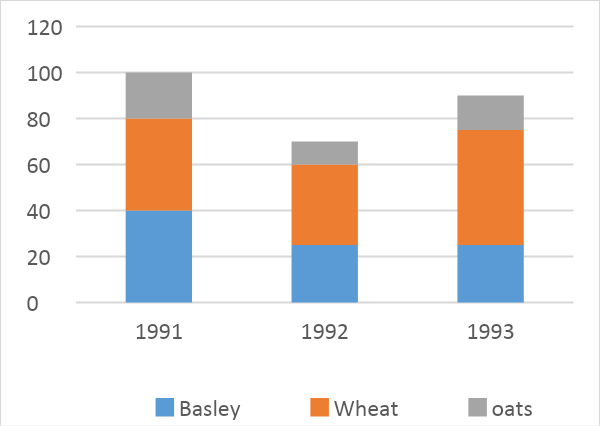
Now to read the graph we will find the height of each corresponding bar
For example we want to calculate the production of Wheat in 1991. Then we will find the height of the bar representing wheat in 1991. Now height is 80 – 40 = 40. Hence the production of wheat in 1991 was 40.
Let us consider the year 1993.
Now in 1993 the production of Basley was 25, production of Wheat was 75 – 25 = 50. and the production of oats is 90 – 75 = 15.
Hence we can say the total production was 25 + 50 + 15 = 90.
Now we know that percentage of wheat production can be calculated by
$\dfrac{\text{production of wheat}}{\text{total production}}\times 100$
Hence we have the percentage of wheat production is $\dfrac{50}{90}\times 100=55.55$
Hence the production of wheat was 55.55 percent.
So, the correct answer is “Option d”.
Note: Now we can also do this in a shortcut way. We know that the production of wheat in 1993 was 50 because the length of the bar graph representing wheat is 50. Now we need not calculate the total production as the total production is nothing but the total height of the bar graph. Hence we easily get that the total production in 1993 was 90.
Complete step-by-step answer:
Now we have the given subdivided bar graph has the representation production of wheat, oats and barley in three consecutive years.
Now to read the graph we will find the height of each corresponding bar
For example we want to calculate the production of Wheat in 1991. Then we will find the height of the bar representing wheat in 1991. Now height is 80 – 40 = 40. Hence the production of wheat in 1991 was 40.
Let us consider the year 1993.
Now in 1993 the production of Basley was 25, production of Wheat was 75 – 25 = 50. and the production of oats is 90 – 75 = 15.
Hence we can say the total production was 25 + 50 + 15 = 90.
Now we know that percentage of wheat production can be calculated by
$\dfrac{\text{production of wheat}}{\text{total production}}\times 100$
Hence we have the percentage of wheat production is $\dfrac{50}{90}\times 100=55.55$
Hence the production of wheat was 55.55 percent.
So, the correct answer is “Option d”.
Note: Now we can also do this in a shortcut way. We know that the production of wheat in 1993 was 50 because the length of the bar graph representing wheat is 50. Now we need not calculate the total production as the total production is nothing but the total height of the bar graph. Hence we easily get that the total production in 1993 was 90.
Recently Updated Pages
Master Class 11 Computer Science: Engaging Questions & Answers for Success
Master Class 11 Business Studies: Engaging Questions & Answers for Success
Master Class 11 Economics: Engaging Questions & Answers for Success
Master Class 11 English: Engaging Questions & Answers for Success
Master Class 11 Maths: Engaging Questions & Answers for Success
Master Class 11 Biology: Engaging Questions & Answers for Success
Trending doubts
One Metric ton is equal to kg A 10000 B 1000 C 100 class 11 physics CBSE
There are 720 permutations of the digits 1 2 3 4 5 class 11 maths CBSE
Discuss the various forms of bacteria class 11 biology CBSE
Draw a diagram of a plant cell and label at least eight class 11 biology CBSE
State the laws of reflection of light
Explain zero factorial class 11 maths CBSE