


How do you graph $2x - 2y = 2$ by plotting points?
Answer
554.1k+ views
Hint: The given straight line is $2x - 2y = 2$
The equation lends itself to setting one variable to $0$ and seeing what the resulting other variables will be, like this:
$2x - 2y = 2$
We simplify the equation and find $x$ and $y$ points.
Complete step-by-step solution:
The given straight line is $2x - 2y = 2$
We’re working with a line-we know this because both $x$ and $y$ terms are of power $1$ (so they aren’t squared or square rooted or anything like that).
With a line, it takes \[2\] points and we can draw a line between them and have that line extend both ways into infinity.
The equation lends itself to setting one variable to $0$ and seeing what the resulting other variables will be, like this: $2x - 2y = 2$
Set $x$ to $0$, hence we get
$ \Rightarrow - 2y = 2$
Divide by $ - 2$ on both sides, hence we get
$ \Rightarrow \dfrac{{ - \not{2}}}{{ - \not{2}}}y = - \dfrac{2}{2}$
Divide $2$ by $2$, hence we get
$ \Rightarrow y = - 1$
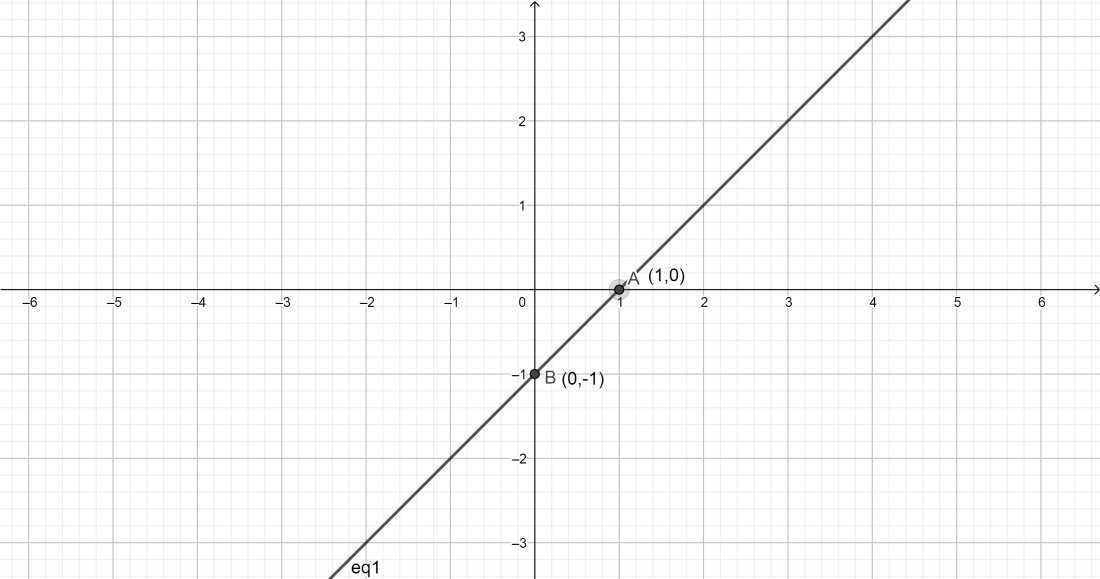
So one point is$(0, - 1)$
Now we $y$ to $0$, hence we get
$ \Rightarrow 2x = 2$
Divide by $2$ on both sides, hence we get
$ \Rightarrow \dfrac{{\not{2}}}{{\not{2}}}x = \dfrac{2}{2}$
Divide $2$ by $2$, hence we get
$ \Rightarrow x = 1$
The other point is $(1,0)$
The plotting point $(x,y)$ is \[(1, - 1)\]
And we can graph those two points and draw the line:
Note: Application of linear graphs:
In our day-to-day life, we observe variation in the value of different quantities depending upon the variation in values of other quantities.
For example: if the number of persons visiting a restaurant increases, the earning of the restaurant increases and vice versa if a number of people are employed, the time taken to accomplish a job decreases.
Thus, in some scenarios, the value of one quantity increases with an increase in the value of another quantity. Sometimes these two quantities exhibit a linear dependence.
We generally represent this with the help of linear graphs.
The equation lends itself to setting one variable to $0$ and seeing what the resulting other variables will be, like this:
$2x - 2y = 2$
We simplify the equation and find $x$ and $y$ points.
Complete step-by-step solution:
The given straight line is $2x - 2y = 2$
We’re working with a line-we know this because both $x$ and $y$ terms are of power $1$ (so they aren’t squared or square rooted or anything like that).
With a line, it takes \[2\] points and we can draw a line between them and have that line extend both ways into infinity.
The equation lends itself to setting one variable to $0$ and seeing what the resulting other variables will be, like this: $2x - 2y = 2$
Set $x$ to $0$, hence we get
$ \Rightarrow - 2y = 2$
Divide by $ - 2$ on both sides, hence we get
$ \Rightarrow \dfrac{{ - \not{2}}}{{ - \not{2}}}y = - \dfrac{2}{2}$
Divide $2$ by $2$, hence we get
$ \Rightarrow y = - 1$
So one point is$(0, - 1)$
Now we $y$ to $0$, hence we get
$ \Rightarrow 2x = 2$
Divide by $2$ on both sides, hence we get
$ \Rightarrow \dfrac{{\not{2}}}{{\not{2}}}x = \dfrac{2}{2}$
Divide $2$ by $2$, hence we get
$ \Rightarrow x = 1$
The other point is $(1,0)$
The plotting point $(x,y)$ is \[(1, - 1)\]
And we can graph those two points and draw the line:
Note: Application of linear graphs:
In our day-to-day life, we observe variation in the value of different quantities depending upon the variation in values of other quantities.
For example: if the number of persons visiting a restaurant increases, the earning of the restaurant increases and vice versa if a number of people are employed, the time taken to accomplish a job decreases.
Thus, in some scenarios, the value of one quantity increases with an increase in the value of another quantity. Sometimes these two quantities exhibit a linear dependence.
We generally represent this with the help of linear graphs.
Recently Updated Pages
Master Class 8 Social Science: Engaging Questions & Answers for Success
Master Class 8 English: Engaging Questions & Answers for Success
Class 8 Question and Answer - Your Ultimate Solutions Guide
Master Class 8 Maths: Engaging Questions & Answers for Success
Master Class 8 Science: Engaging Questions & Answers for Success
Master Class 9 General Knowledge: Engaging Questions & Answers for Success
Trending doubts
What is BLO What is the full form of BLO class 8 social science CBSE
Citizens of India can vote at the age of A 18 years class 8 social science CBSE
Full form of STD, ISD and PCO
Advantages and disadvantages of science
Right to vote is a AFundamental Right BFundamental class 8 social science CBSE
What are the 12 elements of nature class 8 chemistry CBSE