


How do you graph \[5x - 2y = - 10\] using intercepts?
Answer
545.7k+ views
Hint: To solve this we need to give the values of ‘x’ and we can find the values of ‘y’. Otherwise we can find the coordinate of the given equation lying on the line of x- axis, we can find this by substituting the value of ‘y’ is equal to zero (x-intercept). Similarly we can find the coordinate of the equation lying on the line of y- axis, we can find this by substituting the value of ‘x’ equal to zero (y-intercept).
Complete step-by-step answer:
Given, \[5x - 2y = - 10\] .
To find the x-intercept. That is the value of ‘x’ at \[y = 0\] . Substituting this in the given equation. We have,
\[5x - 2(0) = - 10\]
\[5x = - 10\]
Divide by 5 on both sides of the equation,
\[x = \dfrac{{ - 10}}{5}\]
\[ \Rightarrow x = - 2\]
Thus we have a coordinate of the equation which lies on the line of x-axis. The coordinate is \[( - 2,0)\] .
To find the y-intercept. That is the value of ‘y’ at \[x = 0\] . Substituting this in the given equation we have,
\[5(0) - 2y = - 10\]
\[ - 2y = - 10\] .
Divide by \[ - 2\] on both sides of the equation,
\[y = \dfrac{{ - 10}}{{ - 2}}\]
\[ \Rightarrow y = 5\]
Thus we have a coordinate of the equation which lies on the line of the y-axis. The coordinate is \[(0,5)\] .
Thus we have the coordinates \[( - 2,0)\] and \[(0,5)\] .
Let’s plot a graph for this coordinates,
We take scale
x-axis= 1 unit = 1 units
y-axis= 1 unit = 1 units
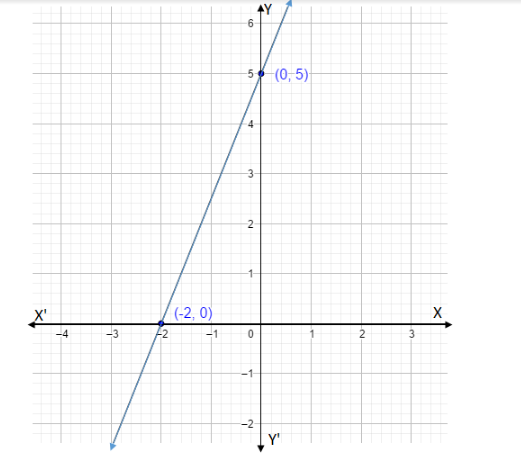
All we did was expand the line touching the coordinates \[( - 2,0)\] and \[(0,5)\] by a straight line.
Note: Intercept method is an easy method for drawing graphs. A graph shows the relation between two variable quantities, it contains two axes perpendicular to each other namely the x-axis and the y-axis. Each variable is measured along one of the axes. In the question, we are given one linear equation containing two variables namely x and y, x is measured along the x-axis and y is measured along the y-axis while tracing the given equations.
Complete step-by-step answer:
Given, \[5x - 2y = - 10\] .
To find the x-intercept. That is the value of ‘x’ at \[y = 0\] . Substituting this in the given equation. We have,
\[5x - 2(0) = - 10\]
\[5x = - 10\]
Divide by 5 on both sides of the equation,
\[x = \dfrac{{ - 10}}{5}\]
\[ \Rightarrow x = - 2\]
Thus we have a coordinate of the equation which lies on the line of x-axis. The coordinate is \[( - 2,0)\] .
To find the y-intercept. That is the value of ‘y’ at \[x = 0\] . Substituting this in the given equation we have,
\[5(0) - 2y = - 10\]
\[ - 2y = - 10\] .
Divide by \[ - 2\] on both sides of the equation,
\[y = \dfrac{{ - 10}}{{ - 2}}\]
\[ \Rightarrow y = 5\]
Thus we have a coordinate of the equation which lies on the line of the y-axis. The coordinate is \[(0,5)\] .
Thus we have the coordinates \[( - 2,0)\] and \[(0,5)\] .
Let’s plot a graph for this coordinates,
We take scale
x-axis= 1 unit = 1 units
y-axis= 1 unit = 1 units
All we did was expand the line touching the coordinates \[( - 2,0)\] and \[(0,5)\] by a straight line.
Note: Intercept method is an easy method for drawing graphs. A graph shows the relation between two variable quantities, it contains two axes perpendicular to each other namely the x-axis and the y-axis. Each variable is measured along one of the axes. In the question, we are given one linear equation containing two variables namely x and y, x is measured along the x-axis and y is measured along the y-axis while tracing the given equations.
Recently Updated Pages
Master Class 8 Social Science: Engaging Questions & Answers for Success
Master Class 8 English: Engaging Questions & Answers for Success
Class 8 Question and Answer - Your Ultimate Solutions Guide
Master Class 8 Maths: Engaging Questions & Answers for Success
Master Class 8 Science: Engaging Questions & Answers for Success
Master Class 9 General Knowledge: Engaging Questions & Answers for Success
Trending doubts
What is BLO What is the full form of BLO class 8 social science CBSE
Citizens of India can vote at the age of A 18 years class 8 social science CBSE
Full form of STD, ISD and PCO
Advantages and disadvantages of science
Right to vote is a AFundamental Right BFundamental class 8 social science CBSE
What are the 12 elements of nature class 8 chemistry CBSE