


How do you graph a decimal on a coordinate graph?
Answer
556.5k+ views
Hint: To plot a point we need to have values of x-coordinate and y-coordinate. Let us consider a real decimal point and then plot a graph by drawing X-axis and Y-axis then mark the points on the graph step by step.
Complete step by step answer:
We have to plot a decimal on a coordinate graph.
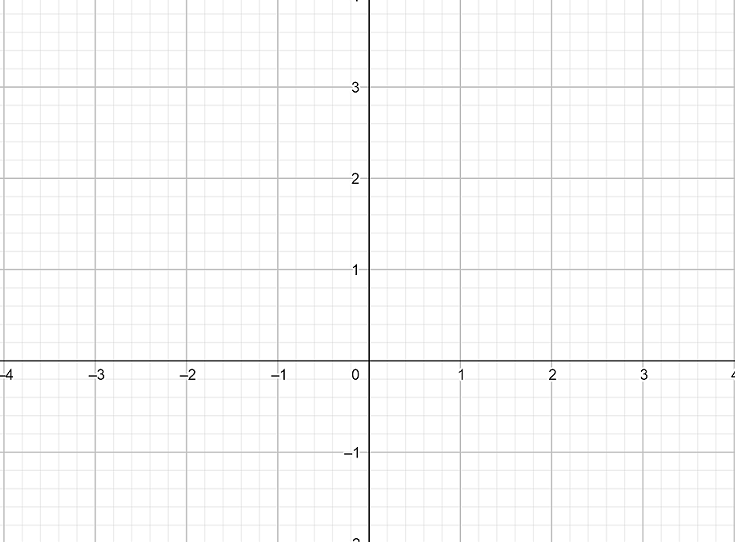
To plot a point on the graph first we need to draw an axis. Let us draw X axis and Y axis on the graph and mark the units by taking 1 unit for each box. Then we will get
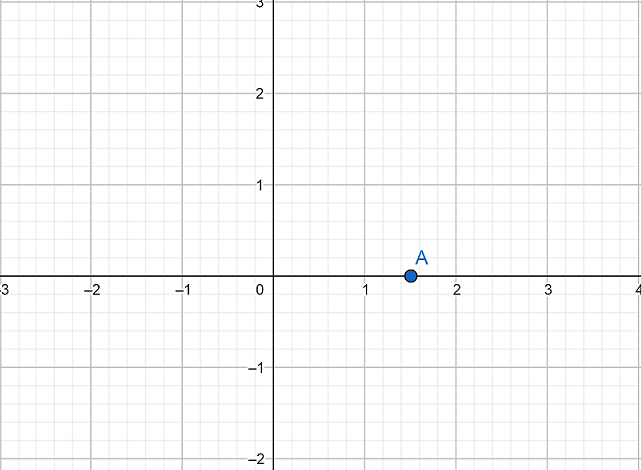
Now, let us consider a point of the form $\left( x,y \right)$ as decimal values $\left( 1.5,2.5 \right)$.
Now, we have a point $\left( 1.5,2.5 \right)$ in which 1.5 is the X-coordinate and 2.5 is the Y-coordinate and both are positive. So, first we move 1.5 places to the right from the origin along the X-axis and then move 2.5 to up and mark the point.
Then we will get
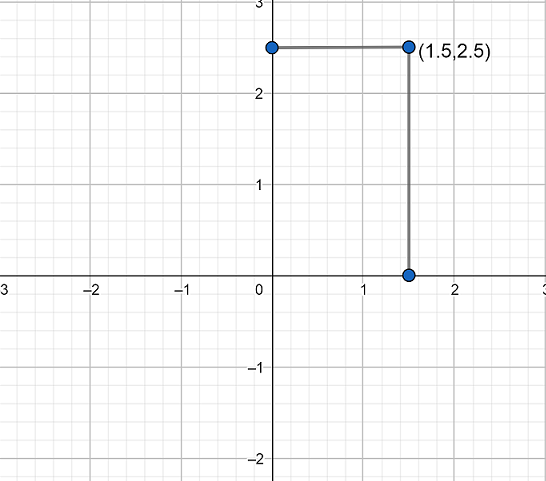
Hence we get the point $\left( 1.5,2.5 \right)$ on the graph.
Note:
Always check the points whether they are positive or negative and draw accordingly. Right hand side from the origin the graph has positive X values and left side has negative X values. Similarly, bottom from the origin has negative Y-values and upward from the origin there is a positive Y-value. If the X-coordinate is zero then the point lies on the Y-axis and when the Y-coordinate is zero the point should lie on the X-axis.
Complete step by step answer:
We have to plot a decimal on a coordinate graph.
To plot a point on the graph first we need to draw an axis. Let us draw X axis and Y axis on the graph and mark the units by taking 1 unit for each box. Then we will get
Now, let us consider a point of the form $\left( x,y \right)$ as decimal values $\left( 1.5,2.5 \right)$.
Now, we have a point $\left( 1.5,2.5 \right)$ in which 1.5 is the X-coordinate and 2.5 is the Y-coordinate and both are positive. So, first we move 1.5 places to the right from the origin along the X-axis and then move 2.5 to up and mark the point.
Then we will get
Hence we get the point $\left( 1.5,2.5 \right)$ on the graph.
Note:
Always check the points whether they are positive or negative and draw accordingly. Right hand side from the origin the graph has positive X values and left side has negative X values. Similarly, bottom from the origin has negative Y-values and upward from the origin there is a positive Y-value. If the X-coordinate is zero then the point lies on the Y-axis and when the Y-coordinate is zero the point should lie on the X-axis.
Recently Updated Pages
Master Class 10 Computer Science: Engaging Questions & Answers for Success
Master Class 10 General Knowledge: Engaging Questions & Answers for Success
Master Class 10 English: Engaging Questions & Answers for Success
Master Class 10 Social Science: Engaging Questions & Answers for Success
Master Class 10 Maths: Engaging Questions & Answers for Success
Master Class 10 Science: Engaging Questions & Answers for Success
Trending doubts
What is the median of the first 10 natural numbers class 10 maths CBSE
Which women's tennis player has 24 Grand Slam singles titles?
Who is the Brand Ambassador of Incredible India?
Why is there a time difference of about 5 hours between class 10 social science CBSE
Write a letter to the principal requesting him to grant class 10 english CBSE
A moving boat is observed from the top of a 150 m high class 10 maths CBSE