


How do you graph, identify the domain, range, and asymptotes for $y=-2\csc x-1$?
Answer
541.5k+ views
Hint: In order to graph the function given in the above question $y=-2\csc x-1$, we need to firstly draw the graph of the function $y=\csc x$. Then, using the transformation of graphs, we can obtain the graph of $y=-\csc x$, and then $y=-2\csc x$ followed by $y=-2\csc x-1$ and then finally $y=-2\csc 2x-1$ using the scaling and inversion of the graphs. The domain and the range of the function can be easily deduced from the obtained graph of the given function, by simply reading it.
Complete step-by-step answer:
The function to be graphed is given in the above question as
\[\Rightarrow y=-2\csc x-1\]
Since the function is a cosecant type function, we consider the graph of the cosecant function, which is written as
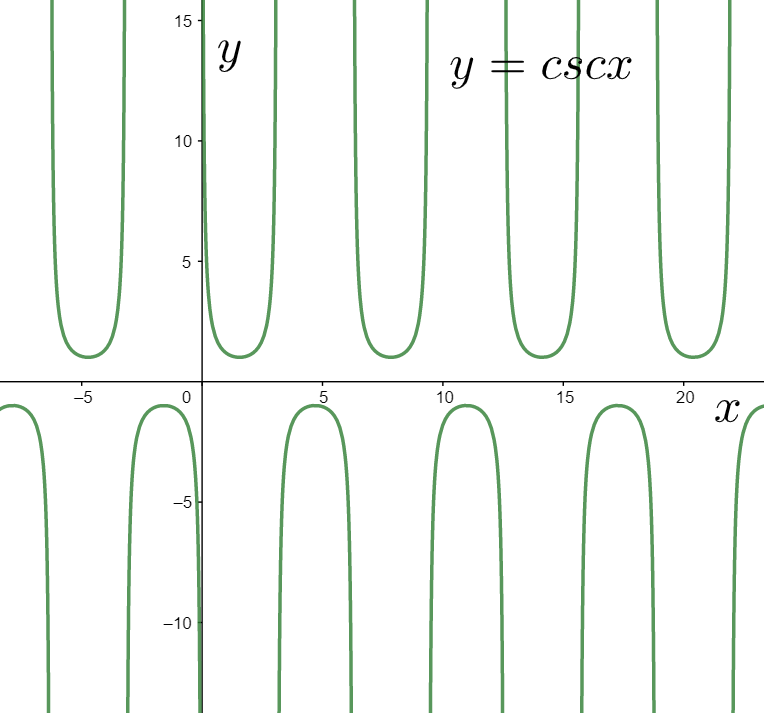
$\Rightarrow y=\csc x$
We know that its graph can be sketched as
Now, we consider the graph of
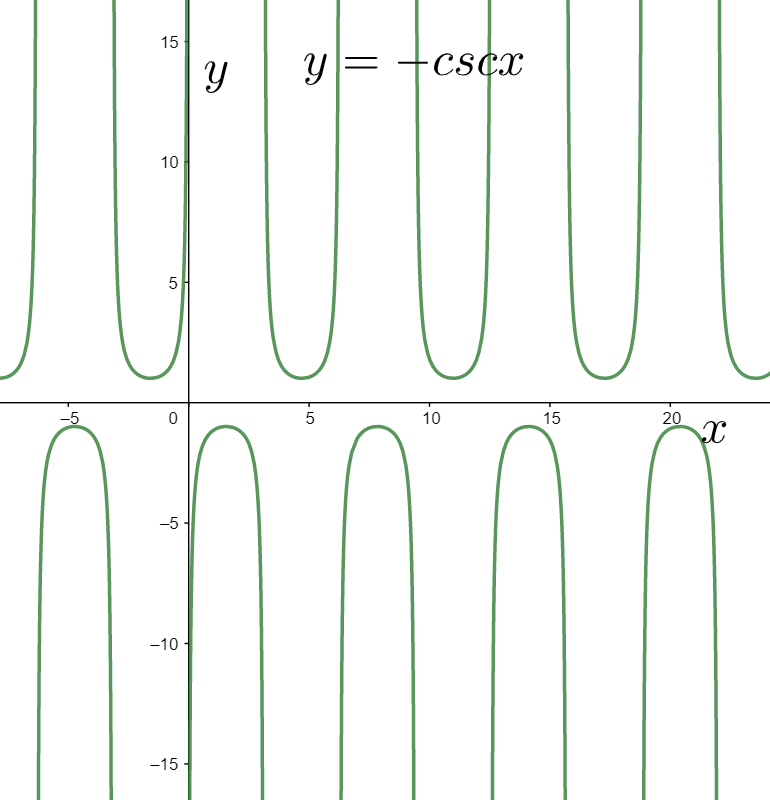
$\Rightarrow y=-\csc x$
It can be obtained by inverting the above graph with respect to the x axis as shown below.
Now, we consider the graph of the function
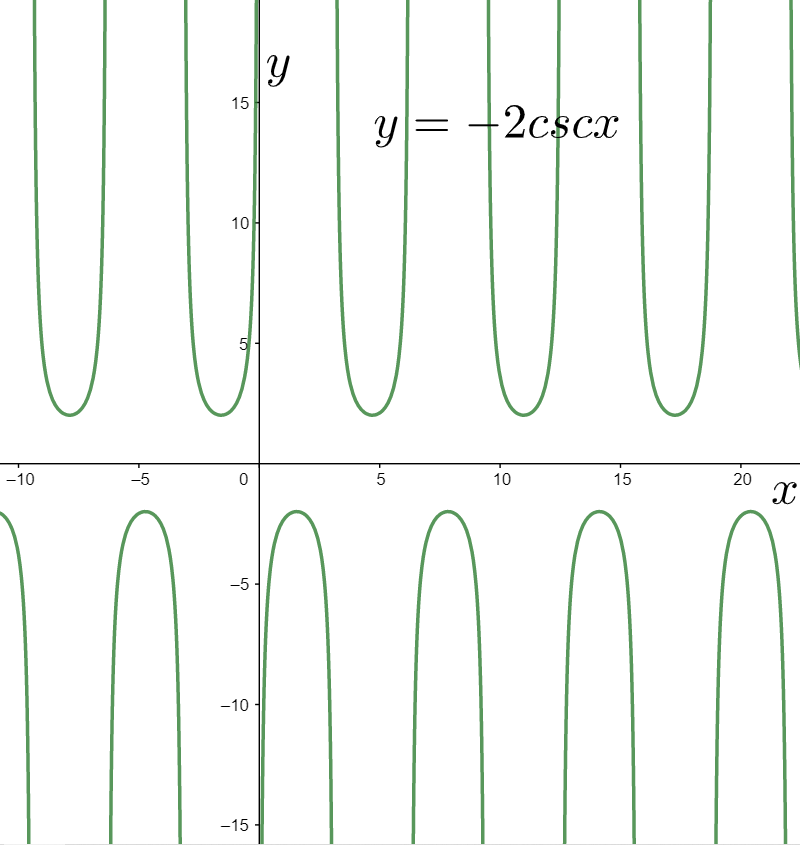
$\Rightarrow y=-2\csc x$
It can be graphed by contracting the graph of the above function by two units in the vertical direction, as shown below.
Now, we consider the graph of
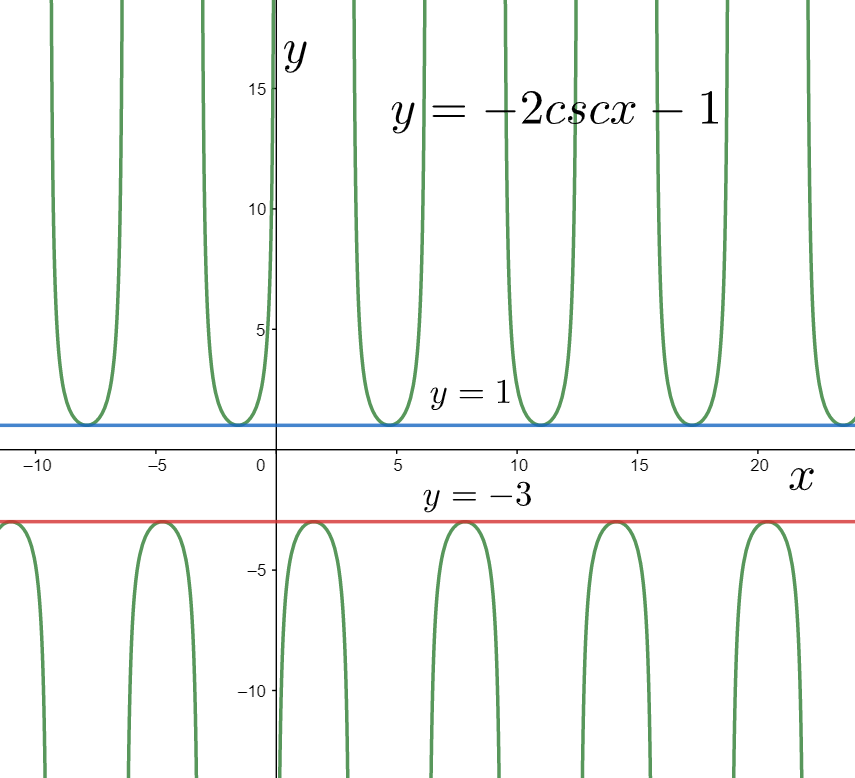
$\Rightarrow y=-2\csc x-1$
For graphing it, we shift the above graph downwards by one unit in the vertical direction, as shown below.
Finally, we consider the graph of the function
$\Rightarrow y=-2\csc 2x-1$
For graphing it, we contract the graph of the above function by two units in the horizontal direction as shown below.
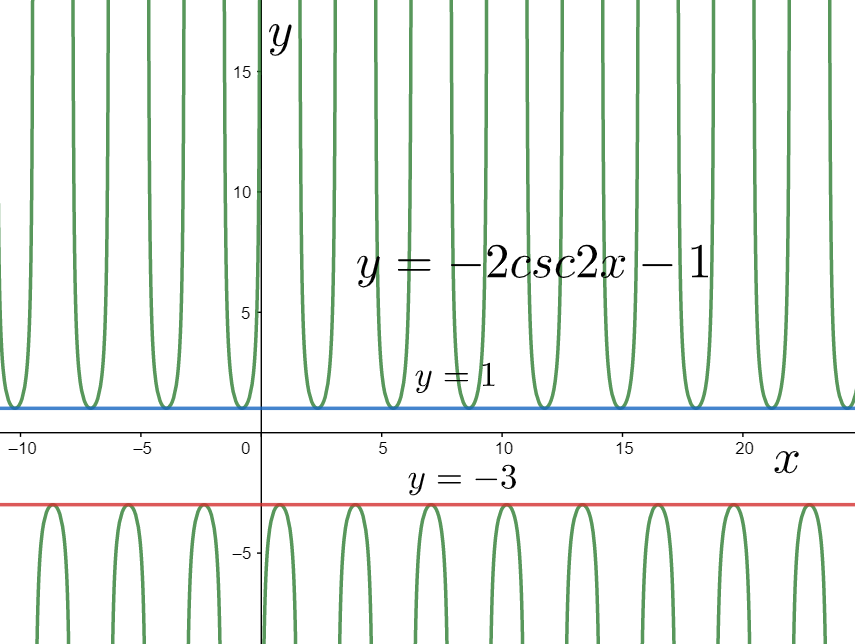
As we can see that the above graph starts from the line $y=1$ and extends infinitely in the positive y direction. Similarly, it starts from the line $y=-3$ and descends infinitely in the negative y direction. Therefore, we can say that its range is equal to $\left( -\infty ,-3 \right]\cup \left[ 1,\infty \right)$.
Now, for obtaining the graph of the given function we started from the graph of the cosecant function $y=\csc x$, which is not defined for the integral multiples of pi. The only transformation done in the x direction was the contraction by two units. Therefore, the given function will not be defined for the integral multiples of $\dfrac{\pi }{2}$. Thus, the domain becomes $R-\left\{ \dfrac{n\pi }{2} \right\},n\in Z$.
Also, the asymptotes are the lines about which the graph of the function approaches. We can see in the above graph that the asymptotes are the lines where the function is not defined, that is, at $x=\dfrac{n\pi }{2},n\in Z$.
Hence, we have identified the domain, range and the asymptotes for the given function.
Note: For solving these types of questions, we must be familiar with the concepts of the transformation of the graphs. We also must remember all the graphs of the basic trigonometric functions, since we need a basic graph to start with obtaining the geaph of a given trigonometric function from the transformation.
Complete step-by-step answer:
The function to be graphed is given in the above question as
\[\Rightarrow y=-2\csc x-1\]
Since the function is a cosecant type function, we consider the graph of the cosecant function, which is written as
$\Rightarrow y=\csc x$
We know that its graph can be sketched as
Now, we consider the graph of
$\Rightarrow y=-\csc x$
It can be obtained by inverting the above graph with respect to the x axis as shown below.
Now, we consider the graph of the function
$\Rightarrow y=-2\csc x$
It can be graphed by contracting the graph of the above function by two units in the vertical direction, as shown below.
Now, we consider the graph of
$\Rightarrow y=-2\csc x-1$
For graphing it, we shift the above graph downwards by one unit in the vertical direction, as shown below.
Finally, we consider the graph of the function
$\Rightarrow y=-2\csc 2x-1$
For graphing it, we contract the graph of the above function by two units in the horizontal direction as shown below.
As we can see that the above graph starts from the line $y=1$ and extends infinitely in the positive y direction. Similarly, it starts from the line $y=-3$ and descends infinitely in the negative y direction. Therefore, we can say that its range is equal to $\left( -\infty ,-3 \right]\cup \left[ 1,\infty \right)$.
Now, for obtaining the graph of the given function we started from the graph of the cosecant function $y=\csc x$, which is not defined for the integral multiples of pi. The only transformation done in the x direction was the contraction by two units. Therefore, the given function will not be defined for the integral multiples of $\dfrac{\pi }{2}$. Thus, the domain becomes $R-\left\{ \dfrac{n\pi }{2} \right\},n\in Z$.
Also, the asymptotes are the lines about which the graph of the function approaches. We can see in the above graph that the asymptotes are the lines where the function is not defined, that is, at $x=\dfrac{n\pi }{2},n\in Z$.
Hence, we have identified the domain, range and the asymptotes for the given function.
Note: For solving these types of questions, we must be familiar with the concepts of the transformation of the graphs. We also must remember all the graphs of the basic trigonometric functions, since we need a basic graph to start with obtaining the geaph of a given trigonometric function from the transformation.
Recently Updated Pages
Master Class 11 Computer Science: Engaging Questions & Answers for Success
Master Class 11 Business Studies: Engaging Questions & Answers for Success
Master Class 11 Economics: Engaging Questions & Answers for Success
Master Class 11 English: Engaging Questions & Answers for Success
Master Class 11 Maths: Engaging Questions & Answers for Success
Master Class 11 Biology: Engaging Questions & Answers for Success
Trending doubts
One Metric ton is equal to kg A 10000 B 1000 C 100 class 11 physics CBSE
There are 720 permutations of the digits 1 2 3 4 5 class 11 maths CBSE
Discuss the various forms of bacteria class 11 biology CBSE
Draw a diagram of a plant cell and label at least eight class 11 biology CBSE
State the laws of reflection of light
Explain zero factorial class 11 maths CBSE