


How do you graph the derivative of a function when you are given the graph of the function?
Answer
543.3k+ views
Hint: We can graph the derivative based on the equation i.e., for the Quadratic equation the curve obtained is line, for the cubic equation the curve obtained is parabola and for typical quartic equation the curve obtained is cubic. Hence based on this we can graph the derivative of a function.
Complete step by step solution:
To graph the derivative of a function when the graph of the function is given, we can graph the derivative based on the equation i.e., for the Quadratic equation the curve obtained is line, for the cubic equation the curve obtained is parabola and for the typical quartic equation the curve obtained is cubic.
The first derivative of a function can be interpreted as the slope of a graph of that function. Where the original graph has a slope of zero (such as at the peaks of a sine wave) then the graph of the first derivative will intersect the \[x\] axis. Where the slope of the original graph is positive then the first derivative graph will have a positive value, and where the slope of the original graph is negative the first derivative graph will have a negative value.
Additionally, we can tell when a derivative is positive or negative by looking at whether a function is increasing or decreasing. Because increasing graphs have positive rates of changes, the derivative will be positive over all x -values where the function is increasing and negative over all the x -values where the function is decreasing.
One more subtle note we can take from a function’s graph is whether for increasing x -values, y increases by a larger amount each time or if y increases by a smaller amount each time (if the rate is unchanging this is the trivial case of a line). This will tell us whether the derivative is increasing or decreasing - we know that in the first case, the slope gets larger for larger x -values, meaning the derivative is increasing. The opposite is also true.
Example to graph the derivative for a function:
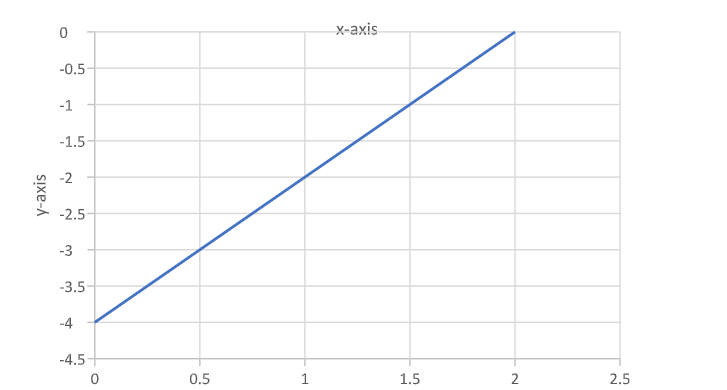
\[y = {x^2} - 4x + 3\]
And its derivative is
\[\dfrac{{dy}}{{dx}} = 2x - 4\]
As the given function is Quadratic, the curve obtained is line as shown in the graph.
Note: The key point to find the derivative is based on the equation given and by the derivative of a function we can get to know that the function is increasing, decreasing, or it is maximum or minimum. If derivative function is greater than zero, this implies that the function is increasing and If derivative function is less than zero, this implies that the function is decreasing.
Complete step by step solution:
To graph the derivative of a function when the graph of the function is given, we can graph the derivative based on the equation i.e., for the Quadratic equation the curve obtained is line, for the cubic equation the curve obtained is parabola and for the typical quartic equation the curve obtained is cubic.
The first derivative of a function can be interpreted as the slope of a graph of that function. Where the original graph has a slope of zero (such as at the peaks of a sine wave) then the graph of the first derivative will intersect the \[x\] axis. Where the slope of the original graph is positive then the first derivative graph will have a positive value, and where the slope of the original graph is negative the first derivative graph will have a negative value.
Additionally, we can tell when a derivative is positive or negative by looking at whether a function is increasing or decreasing. Because increasing graphs have positive rates of changes, the derivative will be positive over all x -values where the function is increasing and negative over all the x -values where the function is decreasing.
One more subtle note we can take from a function’s graph is whether for increasing x -values, y increases by a larger amount each time or if y increases by a smaller amount each time (if the rate is unchanging this is the trivial case of a line). This will tell us whether the derivative is increasing or decreasing - we know that in the first case, the slope gets larger for larger x -values, meaning the derivative is increasing. The opposite is also true.
Example to graph the derivative for a function:
\[y = {x^2} - 4x + 3\]
And its derivative is
\[\dfrac{{dy}}{{dx}} = 2x - 4\]
As the given function is Quadratic, the curve obtained is line as shown in the graph.
Note: The key point to find the derivative is based on the equation given and by the derivative of a function we can get to know that the function is increasing, decreasing, or it is maximum or minimum. If derivative function is greater than zero, this implies that the function is increasing and If derivative function is less than zero, this implies that the function is decreasing.
Recently Updated Pages
Master Class 11 Computer Science: Engaging Questions & Answers for Success
Master Class 11 Business Studies: Engaging Questions & Answers for Success
Master Class 11 Economics: Engaging Questions & Answers for Success
Master Class 11 English: Engaging Questions & Answers for Success
Master Class 11 Maths: Engaging Questions & Answers for Success
Master Class 11 Biology: Engaging Questions & Answers for Success
Trending doubts
One Metric ton is equal to kg A 10000 B 1000 C 100 class 11 physics CBSE
There are 720 permutations of the digits 1 2 3 4 5 class 11 maths CBSE
Discuss the various forms of bacteria class 11 biology CBSE
Draw a diagram of a plant cell and label at least eight class 11 biology CBSE
State the laws of reflection of light
Explain zero factorial class 11 maths CBSE