How do you graph the equation by plotting points $ y + 1 = 0 $ ?
Answer
543.3k+ views
Hint: To solve this question, compare the above given equation to the straight-line equation which is, $ y = mx + c $ and now write the value of the slope and y-intercept. Draw a graph by using the points which were found by comparing the equation. While drawing the graphs, take the correct units so that it looks clear.
Complete step by step solution:
Let us consider the given equation,
$ y + 1 = 0 $
We know that the equation of the straight line is,
$ y = mx + c $ , where $ m $ is the slope and $ c $ is the y-intercept
Now, rearrange the terms in the given equation regarding the straight-line equation we get,
$ y = - 1 $
By looking at the above equation we come to know that it does not have any slope in the straight line and the value of y-intercept is $ - 1 $ , which literally means that when $ x = 0 $ , the value of $ y $ will be $ - 1 $ .
And the required point is $ (0, - 1) $ and the table for the graph is,

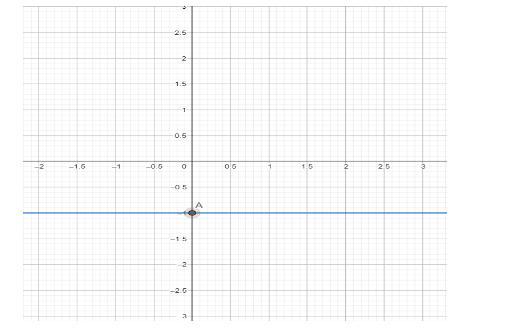
The blue line passing is the line whose equation has been given in the question and the point A, is the point out intersection at y-axis at -1 which forms the equation.
I have taken the unit as $ 1cm $ and the $ x - axis $ contains numbers from $ - 5 $ to $ 5 $ and repeated the same for $ y - axis $ also. This green line in the graph is the solution for the given equation. As the straight line is parallel to the axis, we cannot calculate the slope for the straight line.
This is the required solution.
Note: The line for the equation $ y + 1 = 0 $ is parallel to the $ x - axis $ , so there is no slope for this straight line. The slope or the gradient takes only when the equation of the straight line is perpendicular to the axes.
Complete step by step solution:
Let us consider the given equation,
$ y + 1 = 0 $
We know that the equation of the straight line is,
$ y = mx + c $ , where $ m $ is the slope and $ c $ is the y-intercept
Now, rearrange the terms in the given equation regarding the straight-line equation we get,
$ y = - 1 $
By looking at the above equation we come to know that it does not have any slope in the straight line and the value of y-intercept is $ - 1 $ , which literally means that when $ x = 0 $ , the value of $ y $ will be $ - 1 $ .
And the required point is $ (0, - 1) $ and the table for the graph is,

The blue line passing is the line whose equation has been given in the question and the point A, is the point out intersection at y-axis at -1 which forms the equation.
I have taken the unit as $ 1cm $ and the $ x - axis $ contains numbers from $ - 5 $ to $ 5 $ and repeated the same for $ y - axis $ also. This green line in the graph is the solution for the given equation. As the straight line is parallel to the axis, we cannot calculate the slope for the straight line.
This is the required solution.
Note: The line for the equation $ y + 1 = 0 $ is parallel to the $ x - axis $ , so there is no slope for this straight line. The slope or the gradient takes only when the equation of the straight line is perpendicular to the axes.
Recently Updated Pages
Master Class 8 Social Science: Engaging Questions & Answers for Success

Master Class 8 English: Engaging Questions & Answers for Success

Class 8 Question and Answer - Your Ultimate Solutions Guide

Master Class 8 Maths: Engaging Questions & Answers for Success

Master Class 8 Science: Engaging Questions & Answers for Success

Master Class 9 General Knowledge: Engaging Questions & Answers for Success

Trending doubts
What is BLO What is the full form of BLO class 8 social science CBSE

Citizens of India can vote at the age of A 18 years class 8 social science CBSE

Full form of STD, ISD and PCO

Advantages and disadvantages of science

Right to vote is a AFundamental Right BFundamental class 8 social science CBSE

What are the 12 elements of nature class 8 chemistry CBSE


