


How do I graph the function of \[r = \sin 3\theta \] ?
Answer
542.1k+ views
Hint: Here in this question, we have to plot the graph of the given trigonometric equation. To plot the graph first we have to find the coordinate \[\left( {r,\theta } \right)\] by comparing the general equation of the rose curve i.e., \[r = a\sin 3\theta \] . By finding the coordinate we can plot the required graph of given trigonometric equation
Complete step-by-step answer:
In general let us consider \[r = a\sin (n\theta )\] or \[r = a\sin (n\theta )\] where \[a \ne 0\] and n is a positive number greater than 1. For the graph of rose if the value of n is odd then rose will have n petals or if the value of n is even then the rose will have 2n petals. Here “a” represents the radius of the circle where the rose petals lie.
Now consider the given equation \[r = \sin 3\theta \] . Here a=1, the radius of the circle is 1 and n=3, the number is odd so we have 3 petals for the rose.
Now consider the given equation \[r = \sin (3\theta )\] ------- (1)
Substitute r=0 in equation (1) we have
\[ \Rightarrow 0 = \sin (3\theta )\]
By taking the inverse we have
\[ \Rightarrow {\sin ^{ - 1}}(0) = 3\theta \]
By the table of trigonometry ratios for standard angles in radians we have \[\sin \left( {n\pi } \right) = 0\] , but here n = 1 so we have
\[ \Rightarrow \pi = 3\theta \]
Dividing by 3 on the both sides we have
\[ \Rightarrow \theta = \dfrac{\pi }{3}\]
Therefore \[\left( {\alpha ,\beta } \right) = \left( {r,\theta } \right) = \left( {0,\dfrac{\pi }{3}} \right)\]
While determining the area we use the above coordinates
Hence the graph of the given rose curve equation \[r = \sin 3\theta \] is:
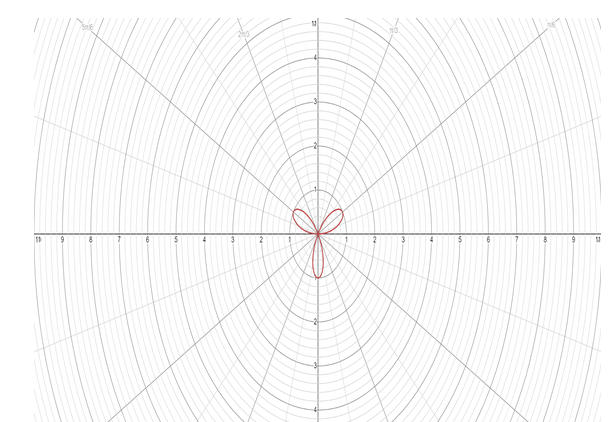
Note: Here we have to plot the polar graph. The polar graph is plotted versus \[r\] and \[\theta \] . By substituting the value of \[\theta \] we can determine the value of \[r\] . Here a=1, the radius of the circle is 1 and n=3, the number is odd so we have 3 petals for the rose. The petals will not exceed the circle of radius
Complete step-by-step answer:
In general let us consider \[r = a\sin (n\theta )\] or \[r = a\sin (n\theta )\] where \[a \ne 0\] and n is a positive number greater than 1. For the graph of rose if the value of n is odd then rose will have n petals or if the value of n is even then the rose will have 2n petals. Here “a” represents the radius of the circle where the rose petals lie.
Now consider the given equation \[r = \sin 3\theta \] . Here a=1, the radius of the circle is 1 and n=3, the number is odd so we have 3 petals for the rose.
Now consider the given equation \[r = \sin (3\theta )\] ------- (1)
Substitute r=0 in equation (1) we have
\[ \Rightarrow 0 = \sin (3\theta )\]
By taking the inverse we have
\[ \Rightarrow {\sin ^{ - 1}}(0) = 3\theta \]
By the table of trigonometry ratios for standard angles in radians we have \[\sin \left( {n\pi } \right) = 0\] , but here n = 1 so we have
\[ \Rightarrow \pi = 3\theta \]
Dividing by 3 on the both sides we have
\[ \Rightarrow \theta = \dfrac{\pi }{3}\]
Therefore \[\left( {\alpha ,\beta } \right) = \left( {r,\theta } \right) = \left( {0,\dfrac{\pi }{3}} \right)\]
While determining the area we use the above coordinates
Hence the graph of the given rose curve equation \[r = \sin 3\theta \] is:
Note: Here we have to plot the polar graph. The polar graph is plotted versus \[r\] and \[\theta \] . By substituting the value of \[\theta \] we can determine the value of \[r\] . Here a=1, the radius of the circle is 1 and n=3, the number is odd so we have 3 petals for the rose. The petals will not exceed the circle of radius
Recently Updated Pages
Master Class 11 Computer Science: Engaging Questions & Answers for Success
Master Class 11 Business Studies: Engaging Questions & Answers for Success
Master Class 11 Economics: Engaging Questions & Answers for Success
Master Class 11 English: Engaging Questions & Answers for Success
Master Class 11 Maths: Engaging Questions & Answers for Success
Master Class 11 Biology: Engaging Questions & Answers for Success
Trending doubts
One Metric ton is equal to kg A 10000 B 1000 C 100 class 11 physics CBSE
There are 720 permutations of the digits 1 2 3 4 5 class 11 maths CBSE
Discuss the various forms of bacteria class 11 biology CBSE
Draw a diagram of a plant cell and label at least eight class 11 biology CBSE
State the laws of reflection of light
Explain zero factorial class 11 maths CBSE