


Graph the function \[y = \cos 2x\]?
Answer
558.6k+ views
Hint: In this question, first we have to find the period and amplitude of the given function, and then take some values for \[x\] and then find the respective \[y\] for each \[x\], then tabulate the values and with help of the table we will get the required graph.
Complete step-by-step answer:
The graph of \[y = \cos x \] is like a wave that forever oscillates between. \[ - 1\] and \[1\], in a shape that repeats itself every \[2\pi \] units. Specifically, this means that the domain of \[\cos x\] is all real numbers, and the range is \[\left[ { - 1,1} \right]\].
Now given function is \[y = \cos 2x\],
Use the form \[y = a\sin \left( {bx - c} \right) + d\] to find the variables used to find the amplitude, period, phase shift, and vertical shift.
\[a = 1\],\[b = 2\],\[c = 0\], and \[d = 0\],
So here amplitude \[a = 1\],
Now period of the function is given by, \[\dfrac{{2\pi }}{{\left| b \right|}}\] from the given data,
So, substituting the value of \[b = 2\] in the period formula, we get,
\[ \Rightarrow \dfrac{{2\pi }}{{\left| 2 \right|}} = \pi \],
Period of the given function will be \[\pi \],
Now select some values to graph the function,
When \[x = 0\],
\[ \Rightarrow \]\[y = \cos 2x\],
Now simplifying we get,
\[ \Rightarrow y = \cos 2\left( 0 \right)\],
Now simplifying we get,
\[y = \cos 0 = 1\]
When \[x = \dfrac{\pi }{2}\],
\[ \Rightarrow y = \cos 2\left( {\dfrac{\pi }{2}} \right)\],
Now simplifying we get,
\[ \Rightarrow y = \cos \pi = - 1\],
When \[x = \pi \],
\[ \Rightarrow y = \cos 2\left( \pi \right)\],
Now simplifying we get,
\[ \Rightarrow y = \cos 2\pi = 1\],
When \[x = \dfrac{{3\pi }}{2}\],
\[ \Rightarrow y = \cos 2\left( {\dfrac{{3\pi }}{2}} \right)\],
Now simplifying we get,
\[ \Rightarrow y = \cos 3\pi = - 1\],
When \[x = 2\pi \],
\[ \Rightarrow y = \cos 2\left( {2\pi } \right)\],
Now simplifying we get,
\[ \Rightarrow y = \cos 4\pi = 1\],
Now tabulating the values we get,
Now plotting the graphs we get,

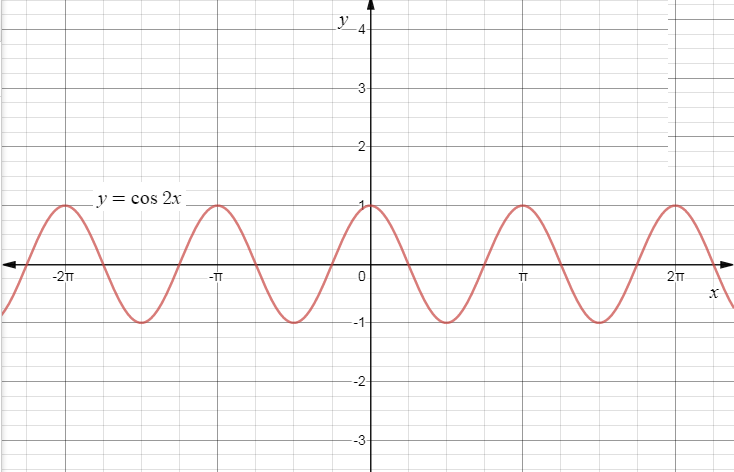
\[\therefore \]The required graph for the function \[y = \cos 2x\] is,
Note:
To graph the cosine function, we mark the angle along the horizontal x axis, and for each angle, we put the cosine of that angle on the vertical y-axis. The graph, as seen above, is a smooth curve that varies from +1 to -1. It is the same shape as the cosine function but displaced to the left \[{90^o}\]. Curves that follow this shape are called 'sinusoidal' after the name of the sine function whose shape it resembles.
Complete step-by-step answer:
The graph of \[y = \cos x \] is like a wave that forever oscillates between. \[ - 1\] and \[1\], in a shape that repeats itself every \[2\pi \] units. Specifically, this means that the domain of \[\cos x\] is all real numbers, and the range is \[\left[ { - 1,1} \right]\].
Now given function is \[y = \cos 2x\],
Use the form \[y = a\sin \left( {bx - c} \right) + d\] to find the variables used to find the amplitude, period, phase shift, and vertical shift.
\[a = 1\],\[b = 2\],\[c = 0\], and \[d = 0\],
So here amplitude \[a = 1\],
Now period of the function is given by, \[\dfrac{{2\pi }}{{\left| b \right|}}\] from the given data,
So, substituting the value of \[b = 2\] in the period formula, we get,
\[ \Rightarrow \dfrac{{2\pi }}{{\left| 2 \right|}} = \pi \],
Period of the given function will be \[\pi \],
Now select some values to graph the function,
When \[x = 0\],
\[ \Rightarrow \]\[y = \cos 2x\],
Now simplifying we get,
\[ \Rightarrow y = \cos 2\left( 0 \right)\],
Now simplifying we get,
\[y = \cos 0 = 1\]
When \[x = \dfrac{\pi }{2}\],
\[ \Rightarrow y = \cos 2\left( {\dfrac{\pi }{2}} \right)\],
Now simplifying we get,
\[ \Rightarrow y = \cos \pi = - 1\],
When \[x = \pi \],
\[ \Rightarrow y = \cos 2\left( \pi \right)\],
Now simplifying we get,
\[ \Rightarrow y = \cos 2\pi = 1\],
When \[x = \dfrac{{3\pi }}{2}\],
\[ \Rightarrow y = \cos 2\left( {\dfrac{{3\pi }}{2}} \right)\],
Now simplifying we get,
\[ \Rightarrow y = \cos 3\pi = - 1\],
When \[x = 2\pi \],
\[ \Rightarrow y = \cos 2\left( {2\pi } \right)\],
Now simplifying we get,
\[ \Rightarrow y = \cos 4\pi = 1\],
Now tabulating the values we get,
| \[x\] | \[y\] |
| 0 | 1 |
| \[\dfrac{\pi }{2}\] | -1 |
| \[\pi \] | 1 |
| \[\dfrac{{3\pi }}{2}\] | -1 |
| \[2\pi \] | 1 |
Now plotting the graphs we get,
\[\therefore \]The required graph for the function \[y = \cos 2x\] is,
Note:
To graph the cosine function, we mark the angle along the horizontal x axis, and for each angle, we put the cosine of that angle on the vertical y-axis. The graph, as seen above, is a smooth curve that varies from +1 to -1. It is the same shape as the cosine function but displaced to the left \[{90^o}\]. Curves that follow this shape are called 'sinusoidal' after the name of the sine function whose shape it resembles.
Recently Updated Pages
Master Class 11 Computer Science: Engaging Questions & Answers for Success
Master Class 11 Business Studies: Engaging Questions & Answers for Success
Master Class 11 Economics: Engaging Questions & Answers for Success
Master Class 11 English: Engaging Questions & Answers for Success
Master Class 11 Maths: Engaging Questions & Answers for Success
Master Class 11 Biology: Engaging Questions & Answers for Success
Trending doubts
One Metric ton is equal to kg A 10000 B 1000 C 100 class 11 physics CBSE
There are 720 permutations of the digits 1 2 3 4 5 class 11 maths CBSE
Discuss the various forms of bacteria class 11 biology CBSE
Draw a diagram of a plant cell and label at least eight class 11 biology CBSE
State the laws of reflection of light
Explain zero factorial class 11 maths CBSE