


Graph the given inequality, $x < 5$.
Answer
561k+ views
Hint:Whenever there is an inequality, first arrange the inequality such that the variable is on the left-hand side. Plot the line for the variable equal to the integer on the right-hand side. For y- axis, “greater than” inequality implies a shaded area above the line and below the line for “less than”. For the x-axis,” greater than” implies the shaded area on the right side and on the left side for “less than” inequality.
Complete step by step solution:
As the question has the variable on the left-hand side and the constant on the right-hand side, there is no need to rearrange the inequality. Hence, we can directly start on the formation of the graph. First draw the line for$x = 5$, which would be vertical line passing through (5,0).
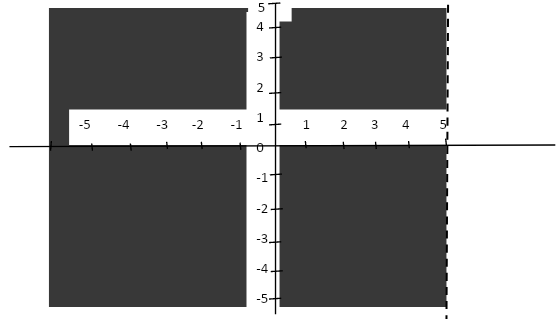
Now, x is less than but not equal to 5, so the line will be dotted and the region on the left will be shaded. The shaded region is the graph of the given inequality.
Note: Graphs are often defined as a picture or a diagram that represents the values in an organized manner. It is a set of all the ordered pairs that satisfy the given equation. These are important to reveal trends and patterns in everyday life.
Complete step by step solution:
As the question has the variable on the left-hand side and the constant on the right-hand side, there is no need to rearrange the inequality. Hence, we can directly start on the formation of the graph. First draw the line for$x = 5$, which would be vertical line passing through (5,0).
Now, x is less than but not equal to 5, so the line will be dotted and the region on the left will be shaded. The shaded region is the graph of the given inequality.
Note: Graphs are often defined as a picture or a diagram that represents the values in an organized manner. It is a set of all the ordered pairs that satisfy the given equation. These are important to reveal trends and patterns in everyday life.
Recently Updated Pages
Master Class 11 Computer Science: Engaging Questions & Answers for Success
Master Class 11 Business Studies: Engaging Questions & Answers for Success
Master Class 11 Economics: Engaging Questions & Answers for Success
Master Class 11 English: Engaging Questions & Answers for Success
Master Class 11 Maths: Engaging Questions & Answers for Success
Master Class 11 Biology: Engaging Questions & Answers for Success
Trending doubts
One Metric ton is equal to kg A 10000 B 1000 C 100 class 11 physics CBSE
There are 720 permutations of the digits 1 2 3 4 5 class 11 maths CBSE
Discuss the various forms of bacteria class 11 biology CBSE
Draw a diagram of a plant cell and label at least eight class 11 biology CBSE
State the laws of reflection of light
Explain zero factorial class 11 maths CBSE