


How do you graph the inequality \[2x > - 6\] and \[x - 4 < 3\] ?
Answer
546.3k+ views
Hint:We simplify the given inequality. Then we draw the graph for a simplified equation. We use intercept form to draw the graph. That is we find the coordinate of the given equation lying on the line of x- axis, we can find this by substituting the value of ‘y’ is equal to zero (x-intercept). Similarly we can find the coordinate of the equation lying on the line of y- axis, we can find this by substituting the value of ‘x’ equal to zero (y-intercept). After drawing the graph we can check in which region the inequality satisfies. We will have a two line parallel to the y-axis.
Complete step by step answer:
Given, \[2x > - 6\] and \[x - 4 < 3\].
Now \[2x > - 6\]
Divide the whole inequality by 2,
\[x > - \dfrac{6}{2}\]
\[\Rightarrow x > - 3\].
Now take \[x - 4 < 3\]
Add 4 on both side of the inequality,
\[x - 4 + 4 < 3 + 4\]
\[\Rightarrow x < 7\]
Now we draw the graph for \[x = - 3\] and \[x = 7\]. For \[x = - 3\] we don’t have a variable ‘y’. So whatever the values we give for ‘y’, the value of ‘x’ will be \[ - 3\]. Thus the coordinates are \[( - 3,1),( - 3,2)( - 3,3)( - 3, - 1)( - 3, - 2)\] and so on. For \[x = 7\] we don’t have a variable ‘y’. So whatever the values we give for ‘y’, the value of ‘x’ will be \[7\]. Thus the coordinates are \[(7,1),(7,2)(7,3)(7, - 1)(7, - 2)\] and so on.Let’s plot a graph for these coordinates. We take scale x-axis= 1 unit = 1 units and y-axis= 1 unit = 1 units.
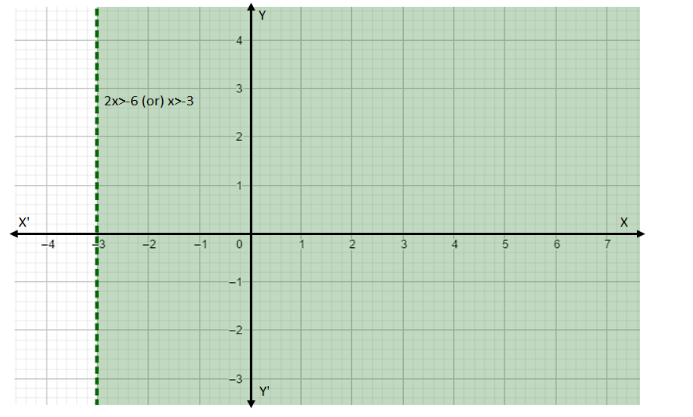
In the above graph the shaded region is the solution of \[2x > - 6\]. Also if we take a point lying on the line \[x = - 3\] the inequality \[2x > - 6\] is not satisfied.
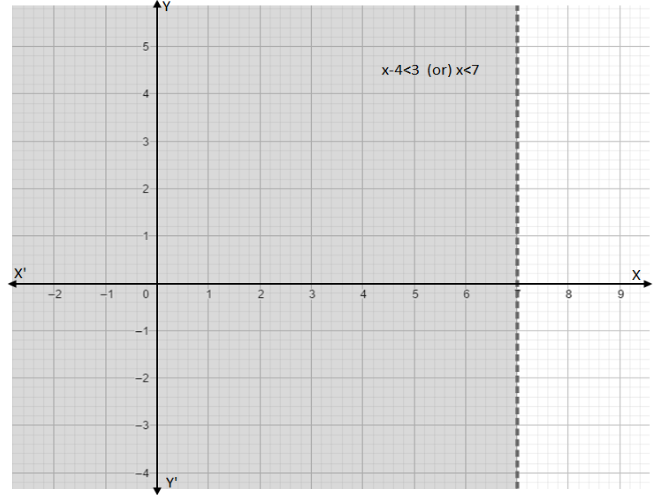
In the above graph the shaded region is the solution of \[x - 4 < 3\]. Also if we take a point lying on the line \[x = 7\] the inequality \[x - 4 < 3\] is not satisfied. In the above graph the shaded region is the solution of the given inequality.
Note:A graph shows the relation between two variable quantities, it contains two axes perpendicular to each other namely the x-axis and the y-axis. Each variable is measured along one of the axes. In the question, we are given one linear equation containing two variables namely x and y, x is measured along the x-axis and y is measured along the y-axis while tracing the given equations.
Complete step by step answer:
Given, \[2x > - 6\] and \[x - 4 < 3\].
Now \[2x > - 6\]
Divide the whole inequality by 2,
\[x > - \dfrac{6}{2}\]
\[\Rightarrow x > - 3\].
Now take \[x - 4 < 3\]
Add 4 on both side of the inequality,
\[x - 4 + 4 < 3 + 4\]
\[\Rightarrow x < 7\]
Now we draw the graph for \[x = - 3\] and \[x = 7\]. For \[x = - 3\] we don’t have a variable ‘y’. So whatever the values we give for ‘y’, the value of ‘x’ will be \[ - 3\]. Thus the coordinates are \[( - 3,1),( - 3,2)( - 3,3)( - 3, - 1)( - 3, - 2)\] and so on. For \[x = 7\] we don’t have a variable ‘y’. So whatever the values we give for ‘y’, the value of ‘x’ will be \[7\]. Thus the coordinates are \[(7,1),(7,2)(7,3)(7, - 1)(7, - 2)\] and so on.Let’s plot a graph for these coordinates. We take scale x-axis= 1 unit = 1 units and y-axis= 1 unit = 1 units.
In the above graph the shaded region is the solution of \[2x > - 6\]. Also if we take a point lying on the line \[x = - 3\] the inequality \[2x > - 6\] is not satisfied.
In the above graph the shaded region is the solution of \[x - 4 < 3\]. Also if we take a point lying on the line \[x = 7\] the inequality \[x - 4 < 3\] is not satisfied. In the above graph the shaded region is the solution of the given inequality.
Note:A graph shows the relation between two variable quantities, it contains two axes perpendicular to each other namely the x-axis and the y-axis. Each variable is measured along one of the axes. In the question, we are given one linear equation containing two variables namely x and y, x is measured along the x-axis and y is measured along the y-axis while tracing the given equations.
Recently Updated Pages
Master Class 11 Computer Science: Engaging Questions & Answers for Success
Master Class 11 Business Studies: Engaging Questions & Answers for Success
Master Class 11 Economics: Engaging Questions & Answers for Success
Master Class 11 English: Engaging Questions & Answers for Success
Master Class 11 Maths: Engaging Questions & Answers for Success
Master Class 11 Biology: Engaging Questions & Answers for Success
Trending doubts
One Metric ton is equal to kg A 10000 B 1000 C 100 class 11 physics CBSE
There are 720 permutations of the digits 1 2 3 4 5 class 11 maths CBSE
Discuss the various forms of bacteria class 11 biology CBSE
Draw a diagram of a plant cell and label at least eight class 11 biology CBSE
State the laws of reflection of light
Explain zero factorial class 11 maths CBSE