


How do you graph the inequality $x\le 5$ ?
Answer
559.5k+ views
Hint: $x\le 5$ means x should always be less than or equal to 5 , in the Cartesian plane we have marked the region in which the x coordinate of all points should be less than or equal to 5. We should not get one point such that the x coordinate of the point is greater than 5.
Complete step by step answer:
The given inequalities is $x\le 5$
To mark the region $x\le 5$ first we have to draw the graph of x=5 , this graph will be a straight line parallel to Y axis and passes through (5,0)
The right side of graph will be the region where the x coordinate will always greater than 5
And the left side of the straight line and the straight line will be the region where the x coordinate of all point will always less than or equal to 5
So our required region is on the straight line and left of straight line x=5
So let’s draw the region $x\le 5$
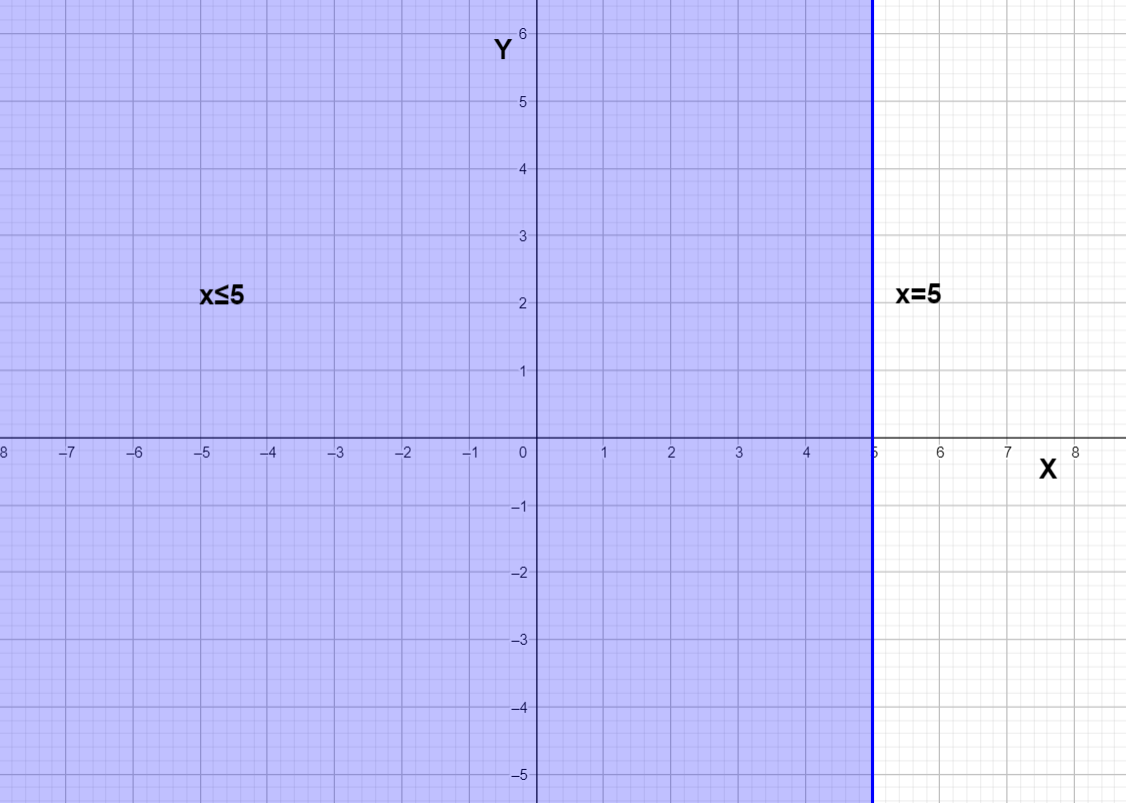
We can see the blue region is the graph of inequality $x\le 5$
Note:
Always note the inequality sign whether it is less than or less than equal to for example while drawing the graph of $x<5$ we will exclude all points on the line x=5, at the same time we will include all the points on the line x=5 while drawing the graph of $x\le 5$.
Complete step by step answer:
The given inequalities is $x\le 5$
To mark the region $x\le 5$ first we have to draw the graph of x=5 , this graph will be a straight line parallel to Y axis and passes through (5,0)
The right side of graph will be the region where the x coordinate will always greater than 5
And the left side of the straight line and the straight line will be the region where the x coordinate of all point will always less than or equal to 5
So our required region is on the straight line and left of straight line x=5
So let’s draw the region $x\le 5$
We can see the blue region is the graph of inequality $x\le 5$
Note:
Always note the inequality sign whether it is less than or less than equal to for example while drawing the graph of $x<5$ we will exclude all points on the line x=5, at the same time we will include all the points on the line x=5 while drawing the graph of $x\le 5$.
Recently Updated Pages
Master Class 10 Computer Science: Engaging Questions & Answers for Success
Master Class 10 General Knowledge: Engaging Questions & Answers for Success
Master Class 10 English: Engaging Questions & Answers for Success
Master Class 10 Social Science: Engaging Questions & Answers for Success
Master Class 10 Maths: Engaging Questions & Answers for Success
Master Class 10 Science: Engaging Questions & Answers for Success
Trending doubts
What is the median of the first 10 natural numbers class 10 maths CBSE
Which women's tennis player has 24 Grand Slam singles titles?
Who is the Brand Ambassador of Incredible India?
Why is there a time difference of about 5 hours between class 10 social science CBSE
Write a letter to the principal requesting him to grant class 10 english CBSE
A moving boat is observed from the top of a 150 m high class 10 maths CBSE