


How do you graph the inequality$y < 2x - 1$?
Answer
558.3k+ views
Hint:In order to graph the above linear inequality having two variables $x\,and\,y$,first graph the equation of the inequality by using the fact that that graph to the equation of the form $ax + by + c = 0$ is always a straight line and to graph a straight line we must requires at least two coordinates. So,1 st coordinate will be our y-intercept obtained by putting $x = 0$in the equation and 2 nd coordinate by taking $x = 1$.The line drawn will be a dashed line as it is not part of the solution. Shade the area below the line as $0 < 2(0) - 1$is not true .
Complete step by step solution:
We are given a linear inequality in two variables , here we are having variable $x$and $y$telling$y < 2x - 1$
In order to graph any inequality we actually first convert inequality into equation by replacing the inequality symbol with the equal$ = $symbol and graph this equation. We get
$y = 2x - 1$
So to plot this linear equation we will recall one most important property of the plane which we have to remember: that graph to any linear equation in two variables of the form $ax + by + c = 0$ will be straight line.
So, in order to draw a line, we must have at least two points on the graph which we can connect to form a line.
To find y-intercept make $x = 0$ in the equation
$
y = 2x - 1 \\
y = 2(0) - 1 \\
y = - 1 \\
$
Now taking $x = 1$
$
y = 2x - 1 \\
y = 2(1) - 1 \\
y = 2 - 1 \\
y = 1 \\
$
Now plotting points $\left( {0, - 1} \right)$and $\left( {1,1} \right)$and connecting them to form the line of the equation $y = 2x - 7$.
The line drawn will be a dashed line, not a solid line. Solid line is only drawn if it is a equation or inequality of form ($ \geqslant , \leqslant $).This line indicates that it is not the part of the solution
Remember one point that every inequality has a range of solutions.
So, to calculate which side of line does our inequality cover putting $x = y = 0$
$
y < 2x - 1 \\
0 < 2(0) - 1 \\
0 < - 1 \\
$
Since 0 is not smaller than -1, so the inequality will contain the area which does not include the origin$(0,0)$i.e. the area below the line .So shade the area below the dashed line .
Below is our final graph ,
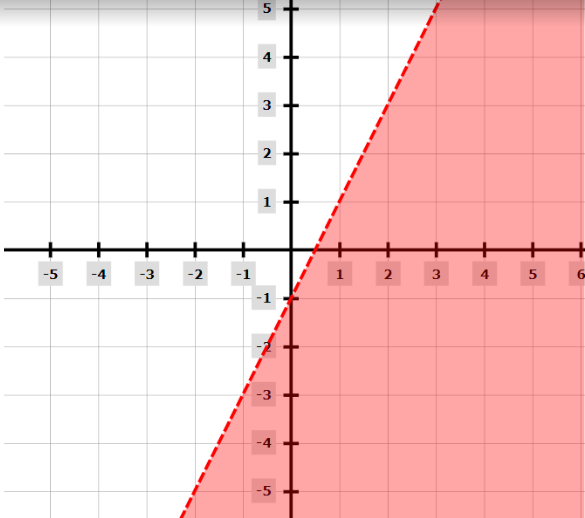
Hence, we’ve successfully plotted our graph of linear inequality $y < 2x - 1$.
Note: 1. Cartesian Plane: A Cartesian Plane is given its name by the French mathematician Rene Descartes ,who first used this plane in the field of mathematics .It is defined as the two mutually perpendicular number line , the one which is horizontal is given name x-axis and the one which is vertical is known as a y-axis. With the help of these axis we can plot any point on this cartesian plane with the help of an ordered pair of numbers.
2.Draw the cartesian plane only with the help of a straight ruler and pencil to get the perfect and accurate results.
3.You can take any two points from the equation to plot the graph to the equation.
Complete step by step solution:
We are given a linear inequality in two variables , here we are having variable $x$and $y$telling$y < 2x - 1$
In order to graph any inequality we actually first convert inequality into equation by replacing the inequality symbol with the equal$ = $symbol and graph this equation. We get
$y = 2x - 1$
So to plot this linear equation we will recall one most important property of the plane which we have to remember: that graph to any linear equation in two variables of the form $ax + by + c = 0$ will be straight line.
So, in order to draw a line, we must have at least two points on the graph which we can connect to form a line.
To find y-intercept make $x = 0$ in the equation
$
y = 2x - 1 \\
y = 2(0) - 1 \\
y = - 1 \\
$
Now taking $x = 1$
$
y = 2x - 1 \\
y = 2(1) - 1 \\
y = 2 - 1 \\
y = 1 \\
$
Now plotting points $\left( {0, - 1} \right)$and $\left( {1,1} \right)$and connecting them to form the line of the equation $y = 2x - 7$.
The line drawn will be a dashed line, not a solid line. Solid line is only drawn if it is a equation or inequality of form ($ \geqslant , \leqslant $).This line indicates that it is not the part of the solution
Remember one point that every inequality has a range of solutions.
So, to calculate which side of line does our inequality cover putting $x = y = 0$
$
y < 2x - 1 \\
0 < 2(0) - 1 \\
0 < - 1 \\
$
Since 0 is not smaller than -1, so the inequality will contain the area which does not include the origin$(0,0)$i.e. the area below the line .So shade the area below the dashed line .
Below is our final graph ,
Hence, we’ve successfully plotted our graph of linear inequality $y < 2x - 1$.
Note: 1. Cartesian Plane: A Cartesian Plane is given its name by the French mathematician Rene Descartes ,who first used this plane in the field of mathematics .It is defined as the two mutually perpendicular number line , the one which is horizontal is given name x-axis and the one which is vertical is known as a y-axis. With the help of these axis we can plot any point on this cartesian plane with the help of an ordered pair of numbers.
2.Draw the cartesian plane only with the help of a straight ruler and pencil to get the perfect and accurate results.
3.You can take any two points from the equation to plot the graph to the equation.
Recently Updated Pages
Master Class 11 Computer Science: Engaging Questions & Answers for Success
Master Class 11 Business Studies: Engaging Questions & Answers for Success
Master Class 11 Economics: Engaging Questions & Answers for Success
Master Class 11 English: Engaging Questions & Answers for Success
Master Class 11 Maths: Engaging Questions & Answers for Success
Master Class 11 Biology: Engaging Questions & Answers for Success
Trending doubts
One Metric ton is equal to kg A 10000 B 1000 C 100 class 11 physics CBSE
There are 720 permutations of the digits 1 2 3 4 5 class 11 maths CBSE
Discuss the various forms of bacteria class 11 biology CBSE
Draw a diagram of a plant cell and label at least eight class 11 biology CBSE
State the laws of reflection of light
Explain zero factorial class 11 maths CBSE