


How do you graph the parabola \[f\left( x \right)={{x}^{2}}\]?
Answer
560.4k+ views
Hint: In this given problem we have to graph the given parabola. The given equation of the parabola \[y={{x}^{2}}\] has the direction open upwards so we can draw an open upwards curve in the graph with its vertex at the origin as the x-intercept and y-intercept of this equation is 0. We can also know that if x is 0 y is also 0. Therefore, the vertex must be the origin. We assume values for x to find the value of y and plot the graph.
Complete step by step answer:
We know that the given equation of the parabola is,
\[y={{x}^{2}}\] …….. (1)
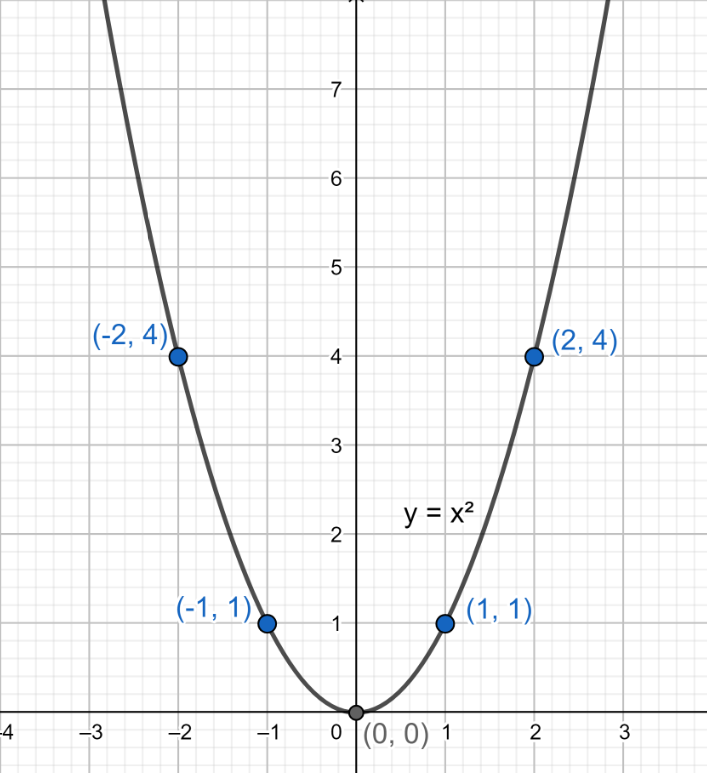
We also know that when x is equal to 0 y is also equal to 0 in the above equation, the vertex is the maximum/minimum point of the curve, therefore the vertex is at the origin \[\left( 0,0 \right)\].
We can assume a value for x to get the point to be plotted in the graph.
When x = 1, the value of y from the equation (1) is,
\[\Rightarrow y=1\]
The point is \[\left( 1,1 \right)\].
When x = 2, the value of y from the equation (1) is,
\[\begin{align}
& \Rightarrow y={{2}^{2}} \\
& \Rightarrow y=4 \\
\end{align}\]
The point is \[\left( 2,4 \right)\].
When x = -1, the value of y from the equation (1) is,
\[\begin{align}
& \Rightarrow y={{\left( -1 \right)}^{2}} \\
& \Rightarrow y=1 \\
\end{align}\]
The point is \[\left( -1,1 \right)\].
When x = -2, the value of y from the equation (1) is,
\[\begin{align}
& \Rightarrow y={{\left( -2 \right)}^{2}} \\
& \Rightarrow y=4 \\
\end{align}\]
The point is \[\left( -2,4 \right)\].
Therefore, the points \[\left( 1,1 \right)\], \[\left( -1,1 \right)\], \[\left( -2,4 \right)\] ,\[\left( 2,4 \right)\] can be plotted in the \[y={{x}^{2}}\]graph.
Note:
Students make mistakes while assuming the values for x to solve for y, which should be concentrated. Students may also make mistakes while plotting the points in the graph. We should check for the vertex point first to plot the curve. We should plot the graph with the correct values.
Complete step by step answer:
We know that the given equation of the parabola is,
\[y={{x}^{2}}\] …….. (1)
We also know that when x is equal to 0 y is also equal to 0 in the above equation, the vertex is the maximum/minimum point of the curve, therefore the vertex is at the origin \[\left( 0,0 \right)\].
We can assume a value for x to get the point to be plotted in the graph.
When x = 1, the value of y from the equation (1) is,
\[\Rightarrow y=1\]
The point is \[\left( 1,1 \right)\].
When x = 2, the value of y from the equation (1) is,
\[\begin{align}
& \Rightarrow y={{2}^{2}} \\
& \Rightarrow y=4 \\
\end{align}\]
The point is \[\left( 2,4 \right)\].
When x = -1, the value of y from the equation (1) is,
\[\begin{align}
& \Rightarrow y={{\left( -1 \right)}^{2}} \\
& \Rightarrow y=1 \\
\end{align}\]
The point is \[\left( -1,1 \right)\].
When x = -2, the value of y from the equation (1) is,
\[\begin{align}
& \Rightarrow y={{\left( -2 \right)}^{2}} \\
& \Rightarrow y=4 \\
\end{align}\]
The point is \[\left( -2,4 \right)\].
Therefore, the points \[\left( 1,1 \right)\], \[\left( -1,1 \right)\], \[\left( -2,4 \right)\] ,\[\left( 2,4 \right)\] can be plotted in the \[y={{x}^{2}}\]graph.
Note:
Students make mistakes while assuming the values for x to solve for y, which should be concentrated. Students may also make mistakes while plotting the points in the graph. We should check for the vertex point first to plot the curve. We should plot the graph with the correct values.
Recently Updated Pages
Master Class 10 Computer Science: Engaging Questions & Answers for Success
Master Class 10 General Knowledge: Engaging Questions & Answers for Success
Master Class 10 English: Engaging Questions & Answers for Success
Master Class 10 Social Science: Engaging Questions & Answers for Success
Master Class 10 Maths: Engaging Questions & Answers for Success
Master Class 10 Science: Engaging Questions & Answers for Success
Trending doubts
What is the median of the first 10 natural numbers class 10 maths CBSE
Which women's tennis player has 24 Grand Slam singles titles?
Who is the Brand Ambassador of Incredible India?
Why is there a time difference of about 5 hours between class 10 social science CBSE
Write a letter to the principal requesting him to grant class 10 english CBSE
A moving boat is observed from the top of a 150 m high class 10 maths CBSE